Irek Piekarski started trading Forex in 2012, because it is easy to learn for beginners.
3 years with Forex then started trading Equities.
More opportunities when using both.
2 years later started trading Crypto
Now he trades all 3 markets.
Beginners should start with Forex!
At the end once you master at least one of them, you can start trading other markets. And you should too in order to diversify.
2. Markets
Forex market is the biggest. Most liquid. Price action is clean, constistent.
The whole world is trading it.
24 hours a day 5 days a week.
Nyit: Vasárnap 10pm GMT
Zár: Péntek 9pm GMT
Focus only on major currency pairs!
Here is a list of 28 major currency crosses (pairs):
– AUDUSD, AUDCAD, AUDCHF, AUDJPY, AUDNZD, USDCAD, CADCHF, CADJPY, CHFJPY, USDCHF, EURUSD, EURAUD, EURCAD, EURCHF, EURGBP, EURJPY, EURNZD, GBPUSD, GBPAUD, GBPCAD, GBPCHF, GBPJPY, GBPNZD, USDJPY, NZDUSD, NZDCAD, NZDCHF, NZDJPY
Others:
– USOIL, UKOIL, XAGUSD (silver), XAUUSD (gold), USDOLLAR or DXY (US Dollar Index - not used for trading, just for reference)
3. Tradingview Setup
4. Foundations/Indicators
MACD:
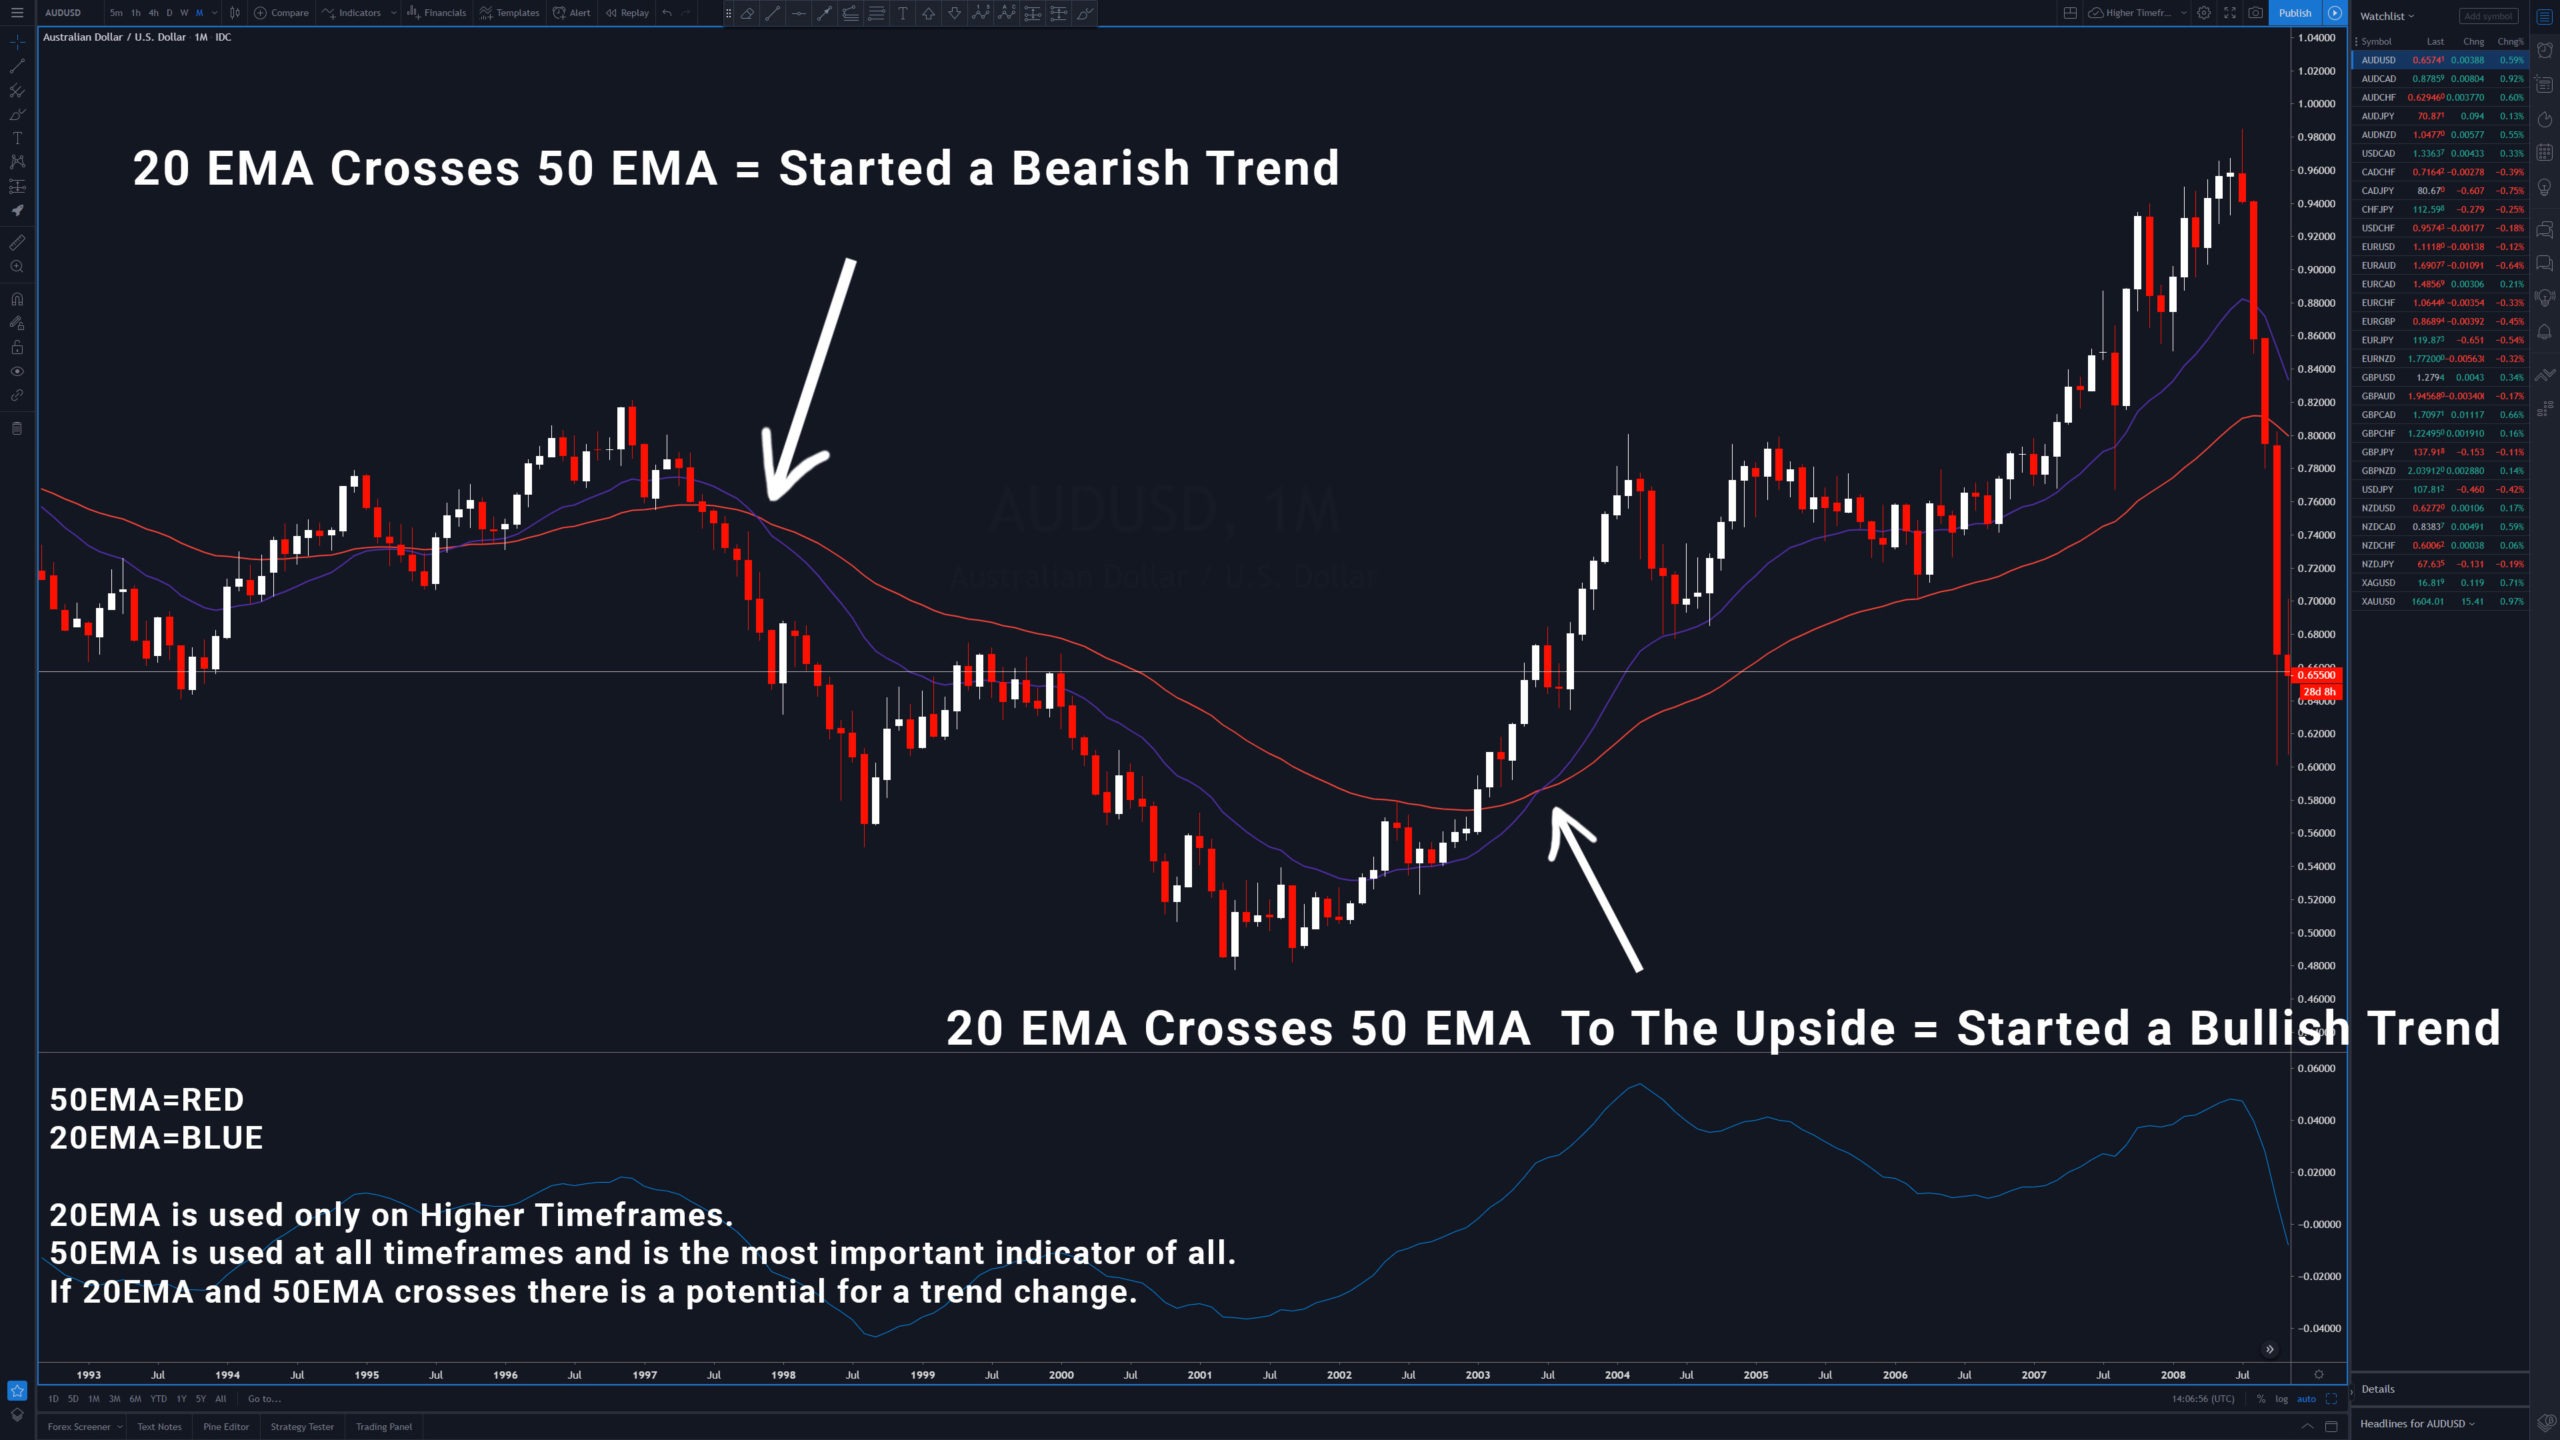
20EMA & 50EMA
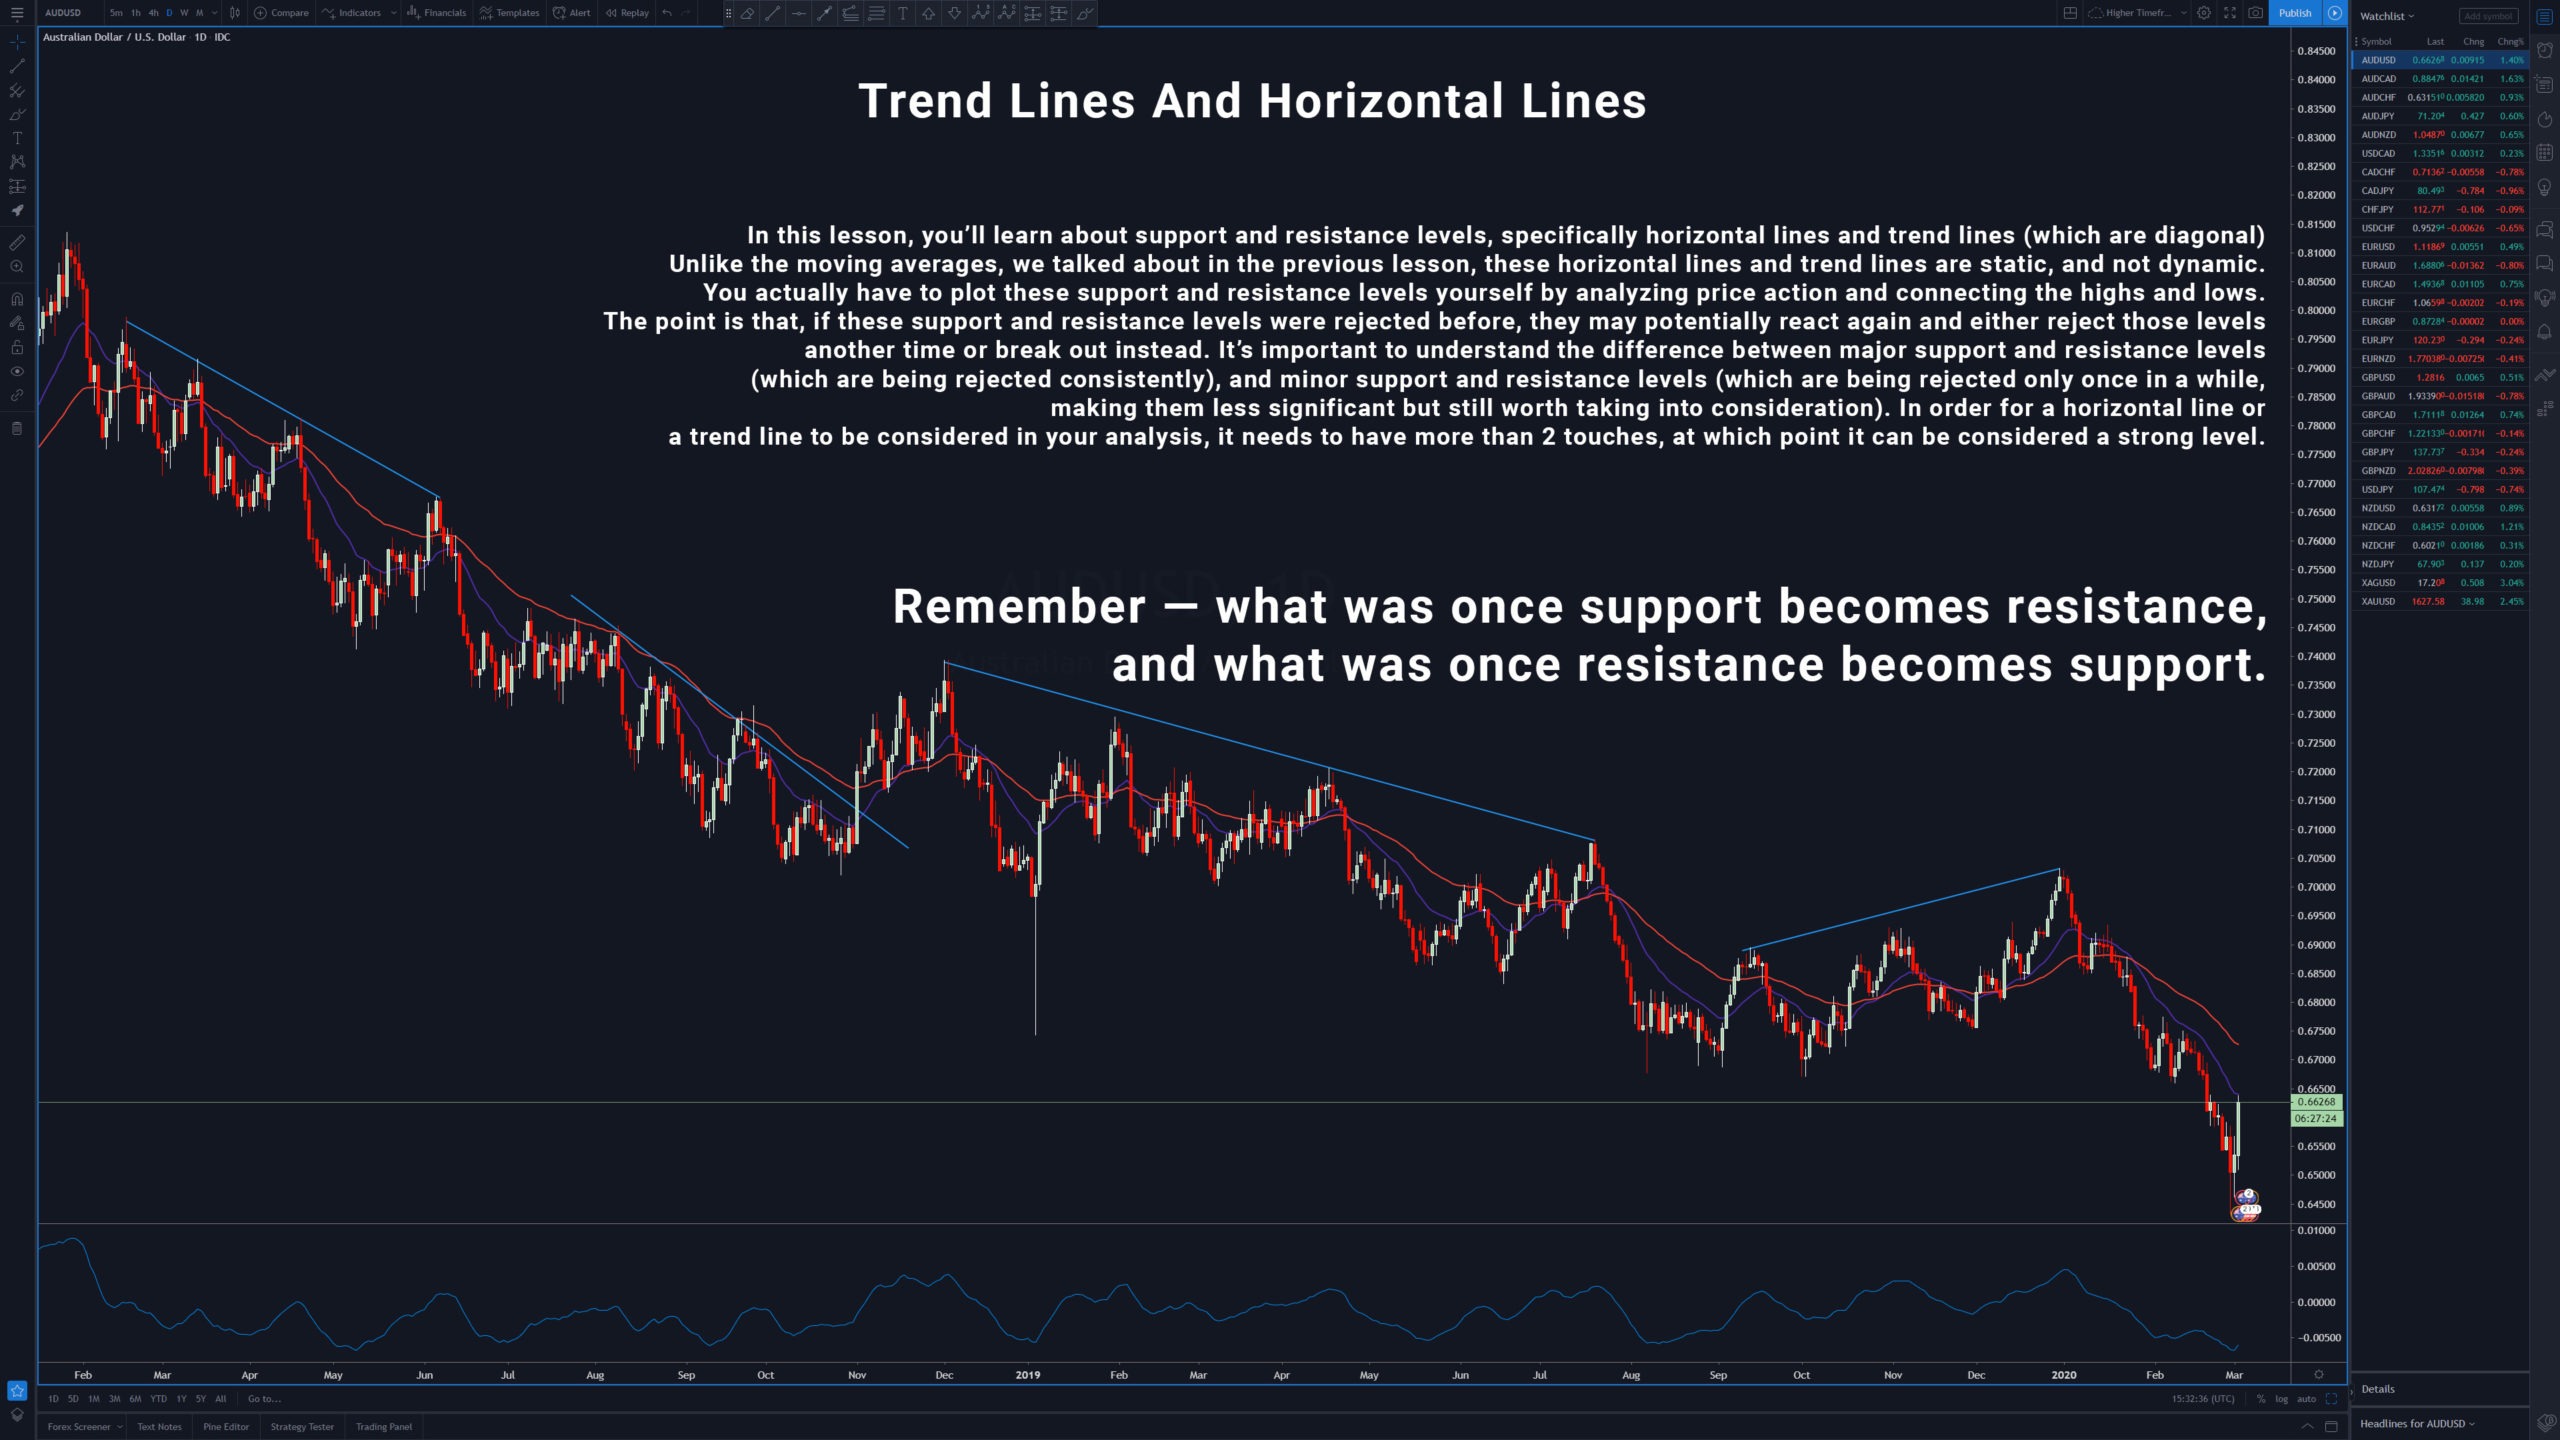
Support & Resistance
VOLUME
This indicator tells us that there is a lot of action or volatility in the market. We will utilize this indicator on the 5-minute timeframe only, for timing our entries. When volume spikes this means people are buying or selling and we want to mainly trade around periods of high volume which, will allow for momentum. In this lesson, Irek explains when the high volume trading sessions take place for the foreign exchange market (London, NY and Asian Session). Regarding the equities market, generally, you’ll see volume spiking within the first hour or so after market open, and potentially again during the last hour for an end of day run.
Candles
Reversal Candlestick Formations
All Candlestick Formations Should Be Rejecting Something. They must always happen at support/resistence.
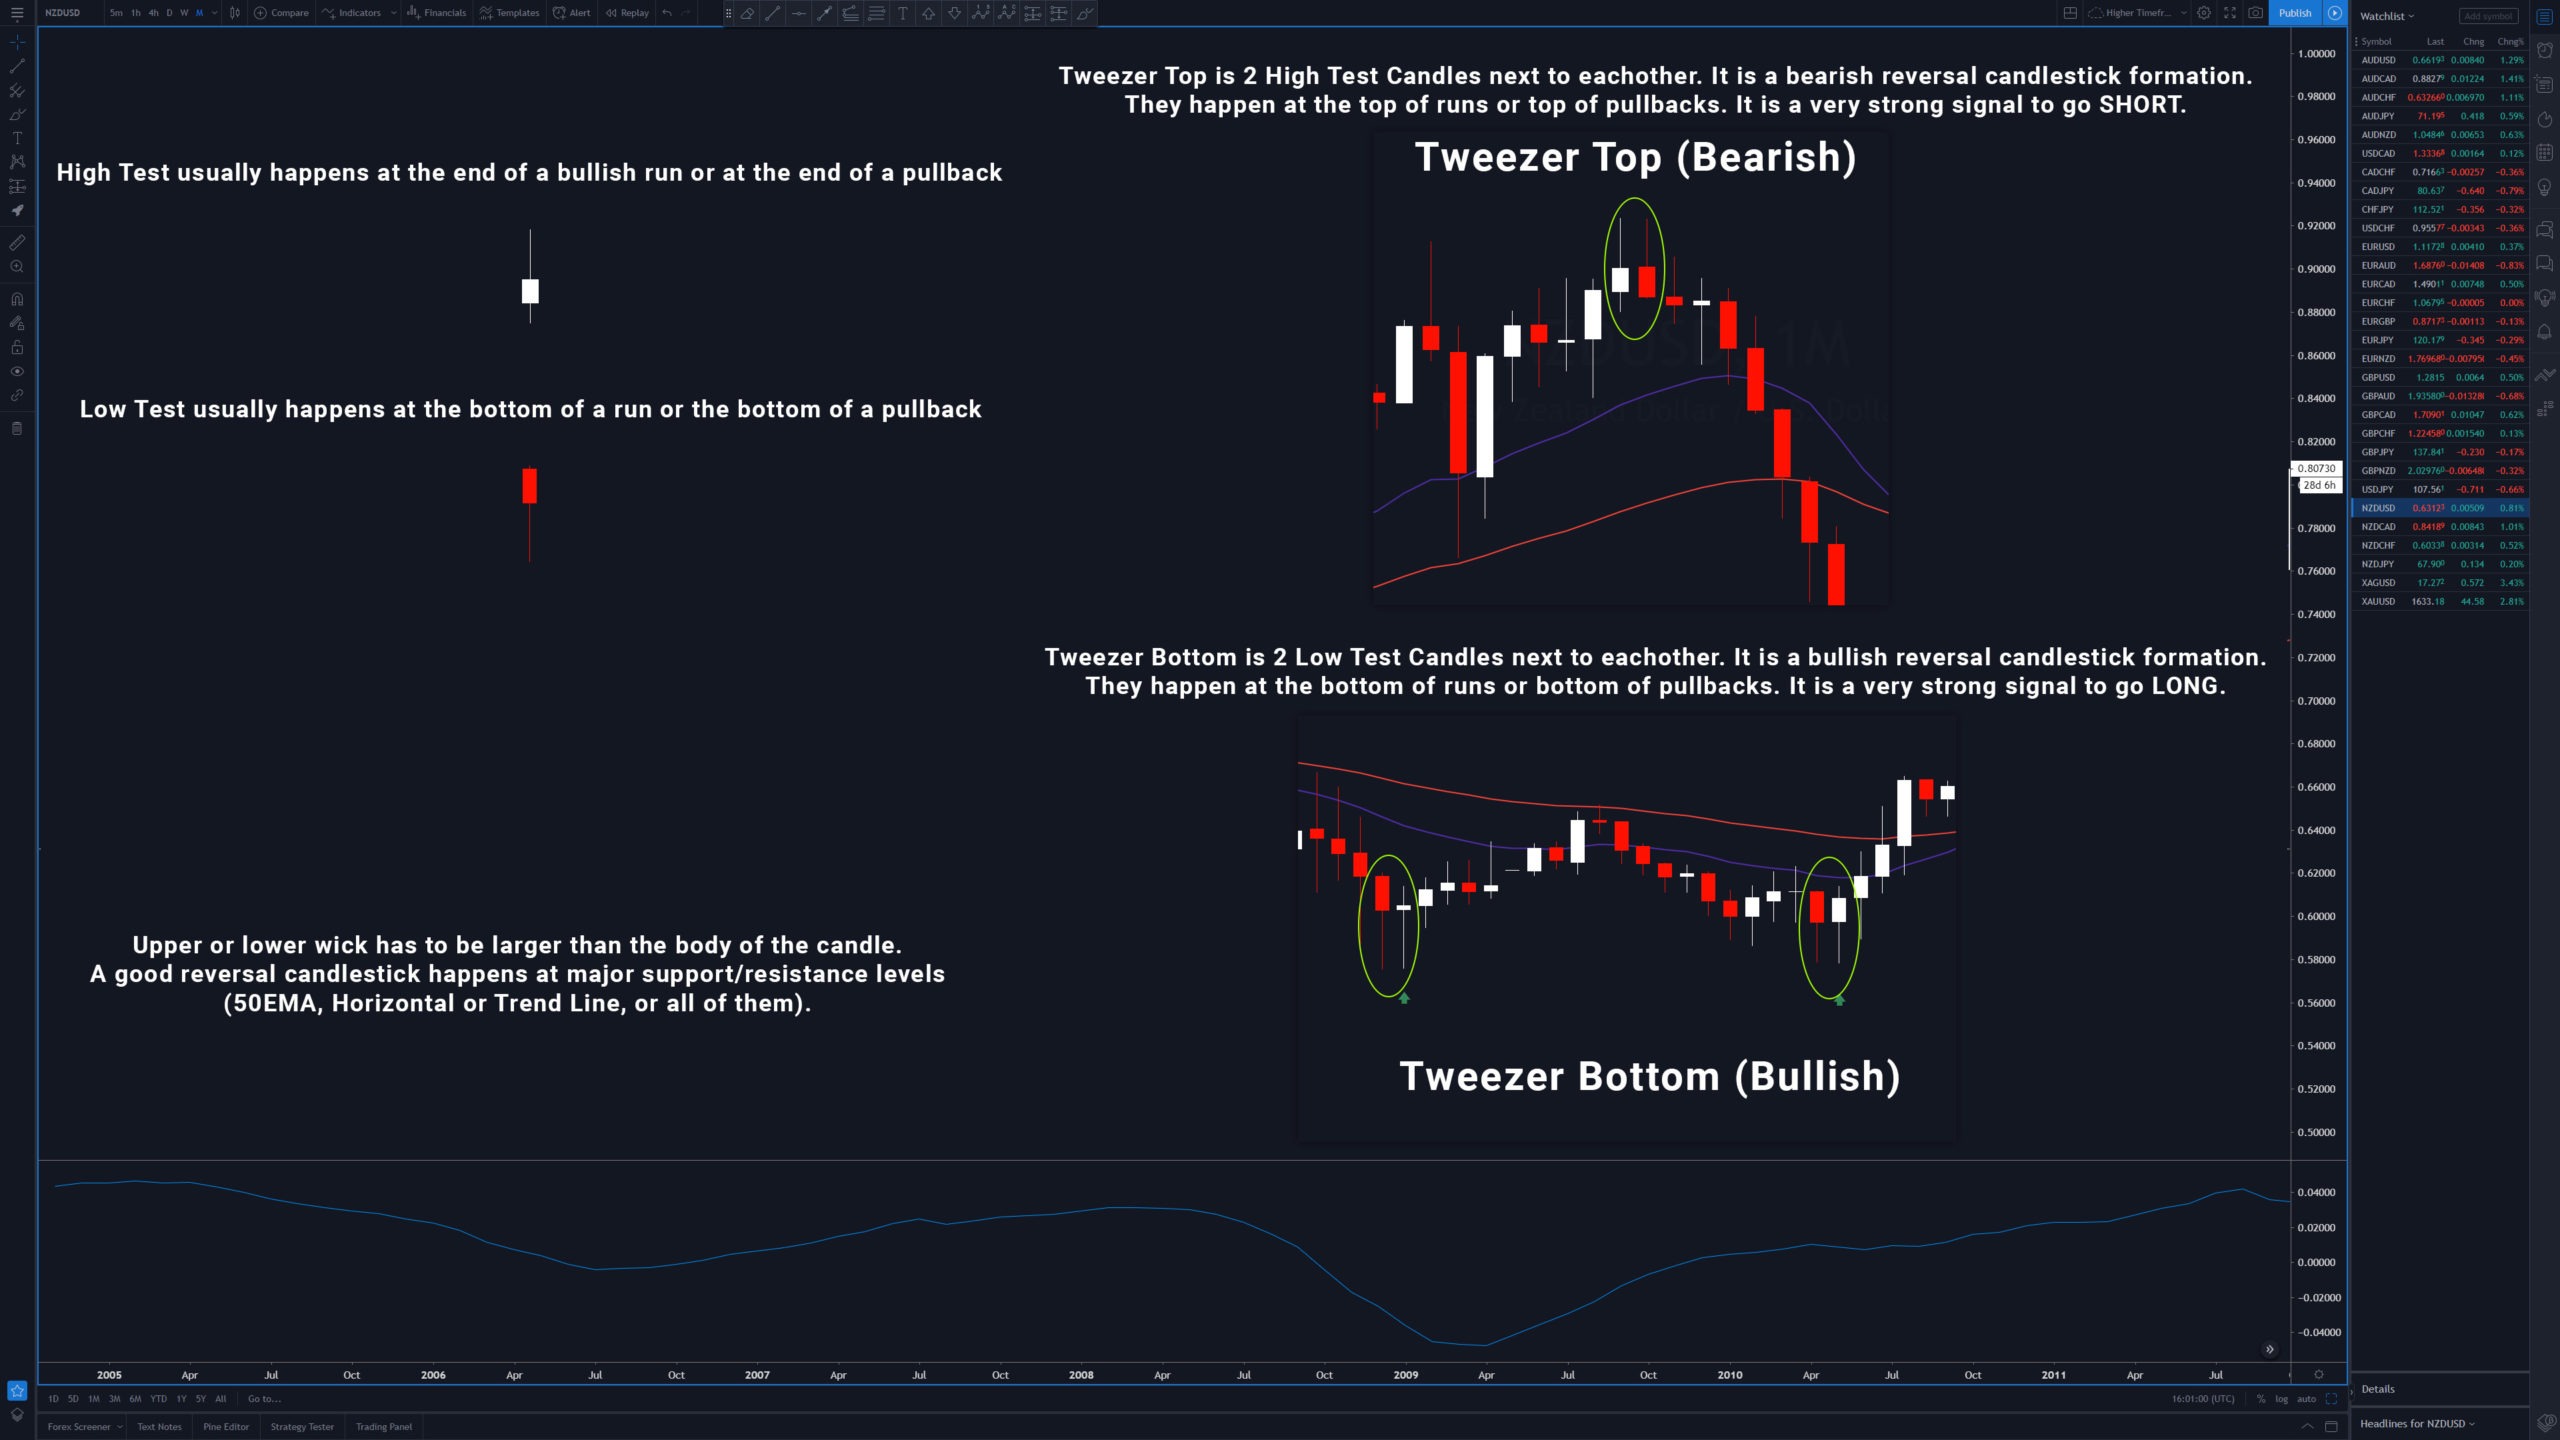
High-test / low-test
– Tweezer top / tweezer bottom
Bullish high test = white Bearish high test = red Bullish low test = white Bearish low test = red on the picture below, we have a bullish high test, and a bearish low test.
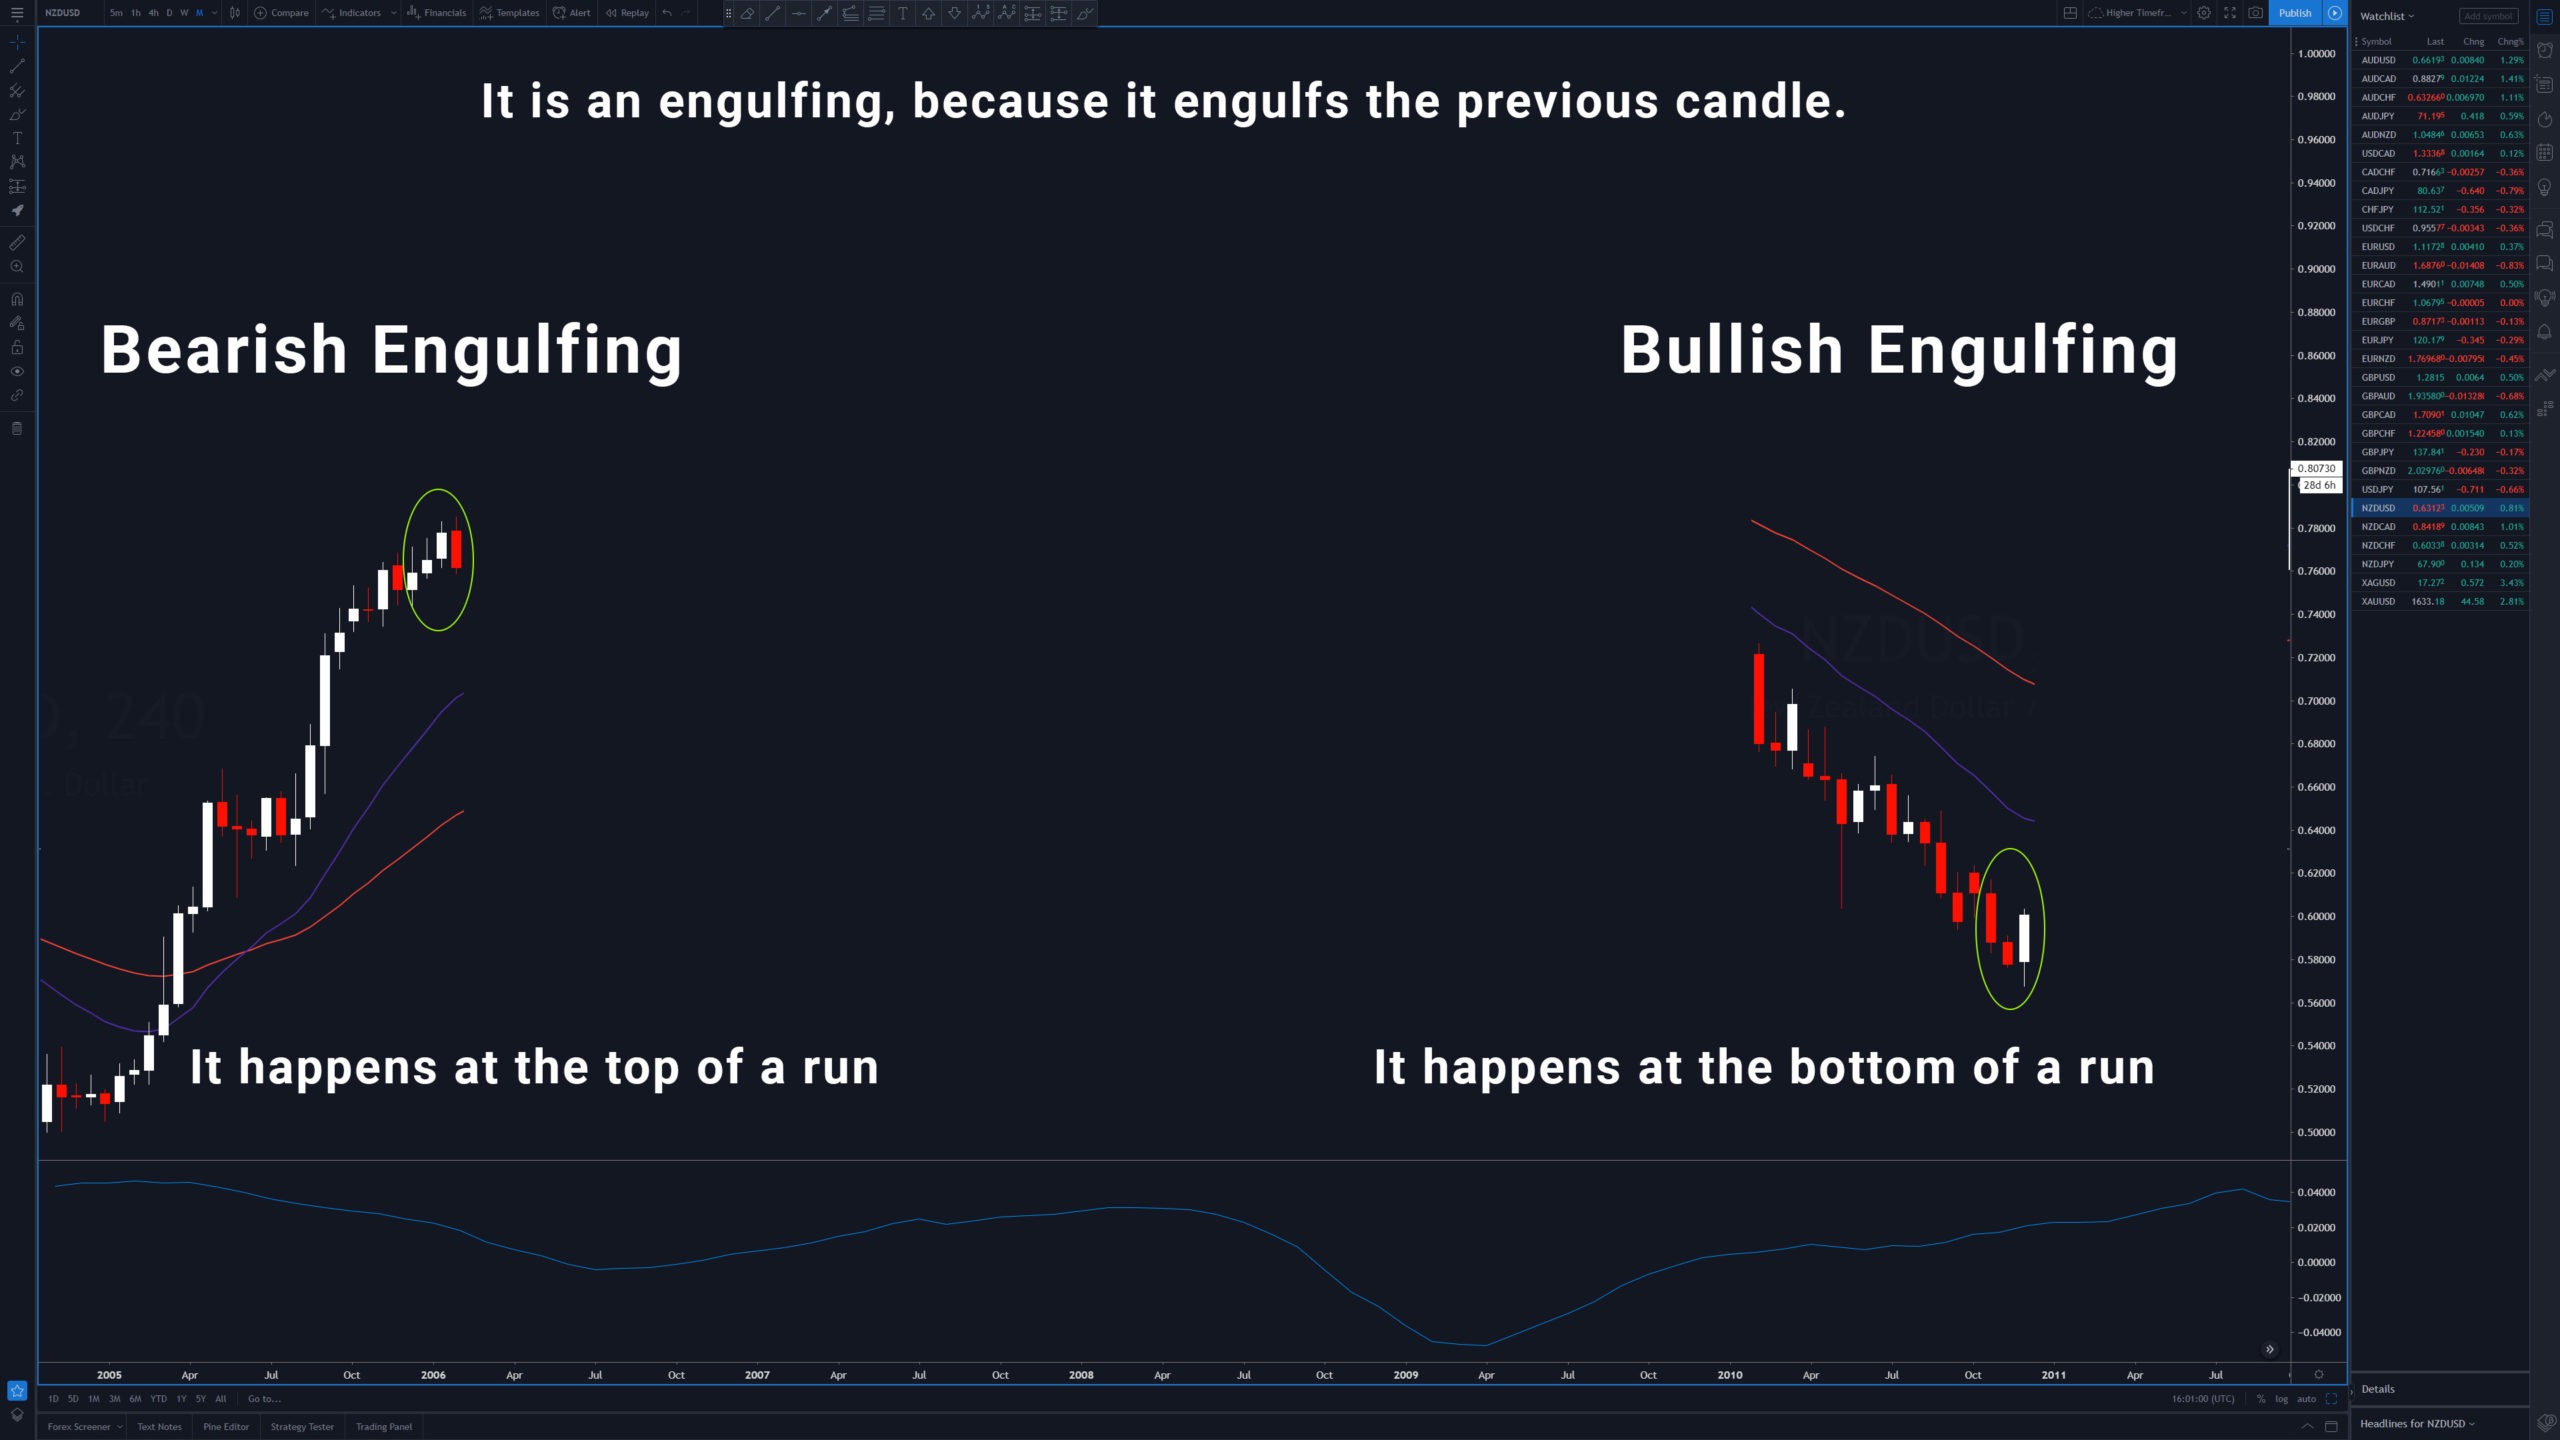
Bearish / bullish engulfing
It must be rejecting something, for it to be a valid.
The following ones are not as strong as the previous ones.
These are strong when there is a combination of candlestick formation patterns.
For example: Combined with a high-test reversal.
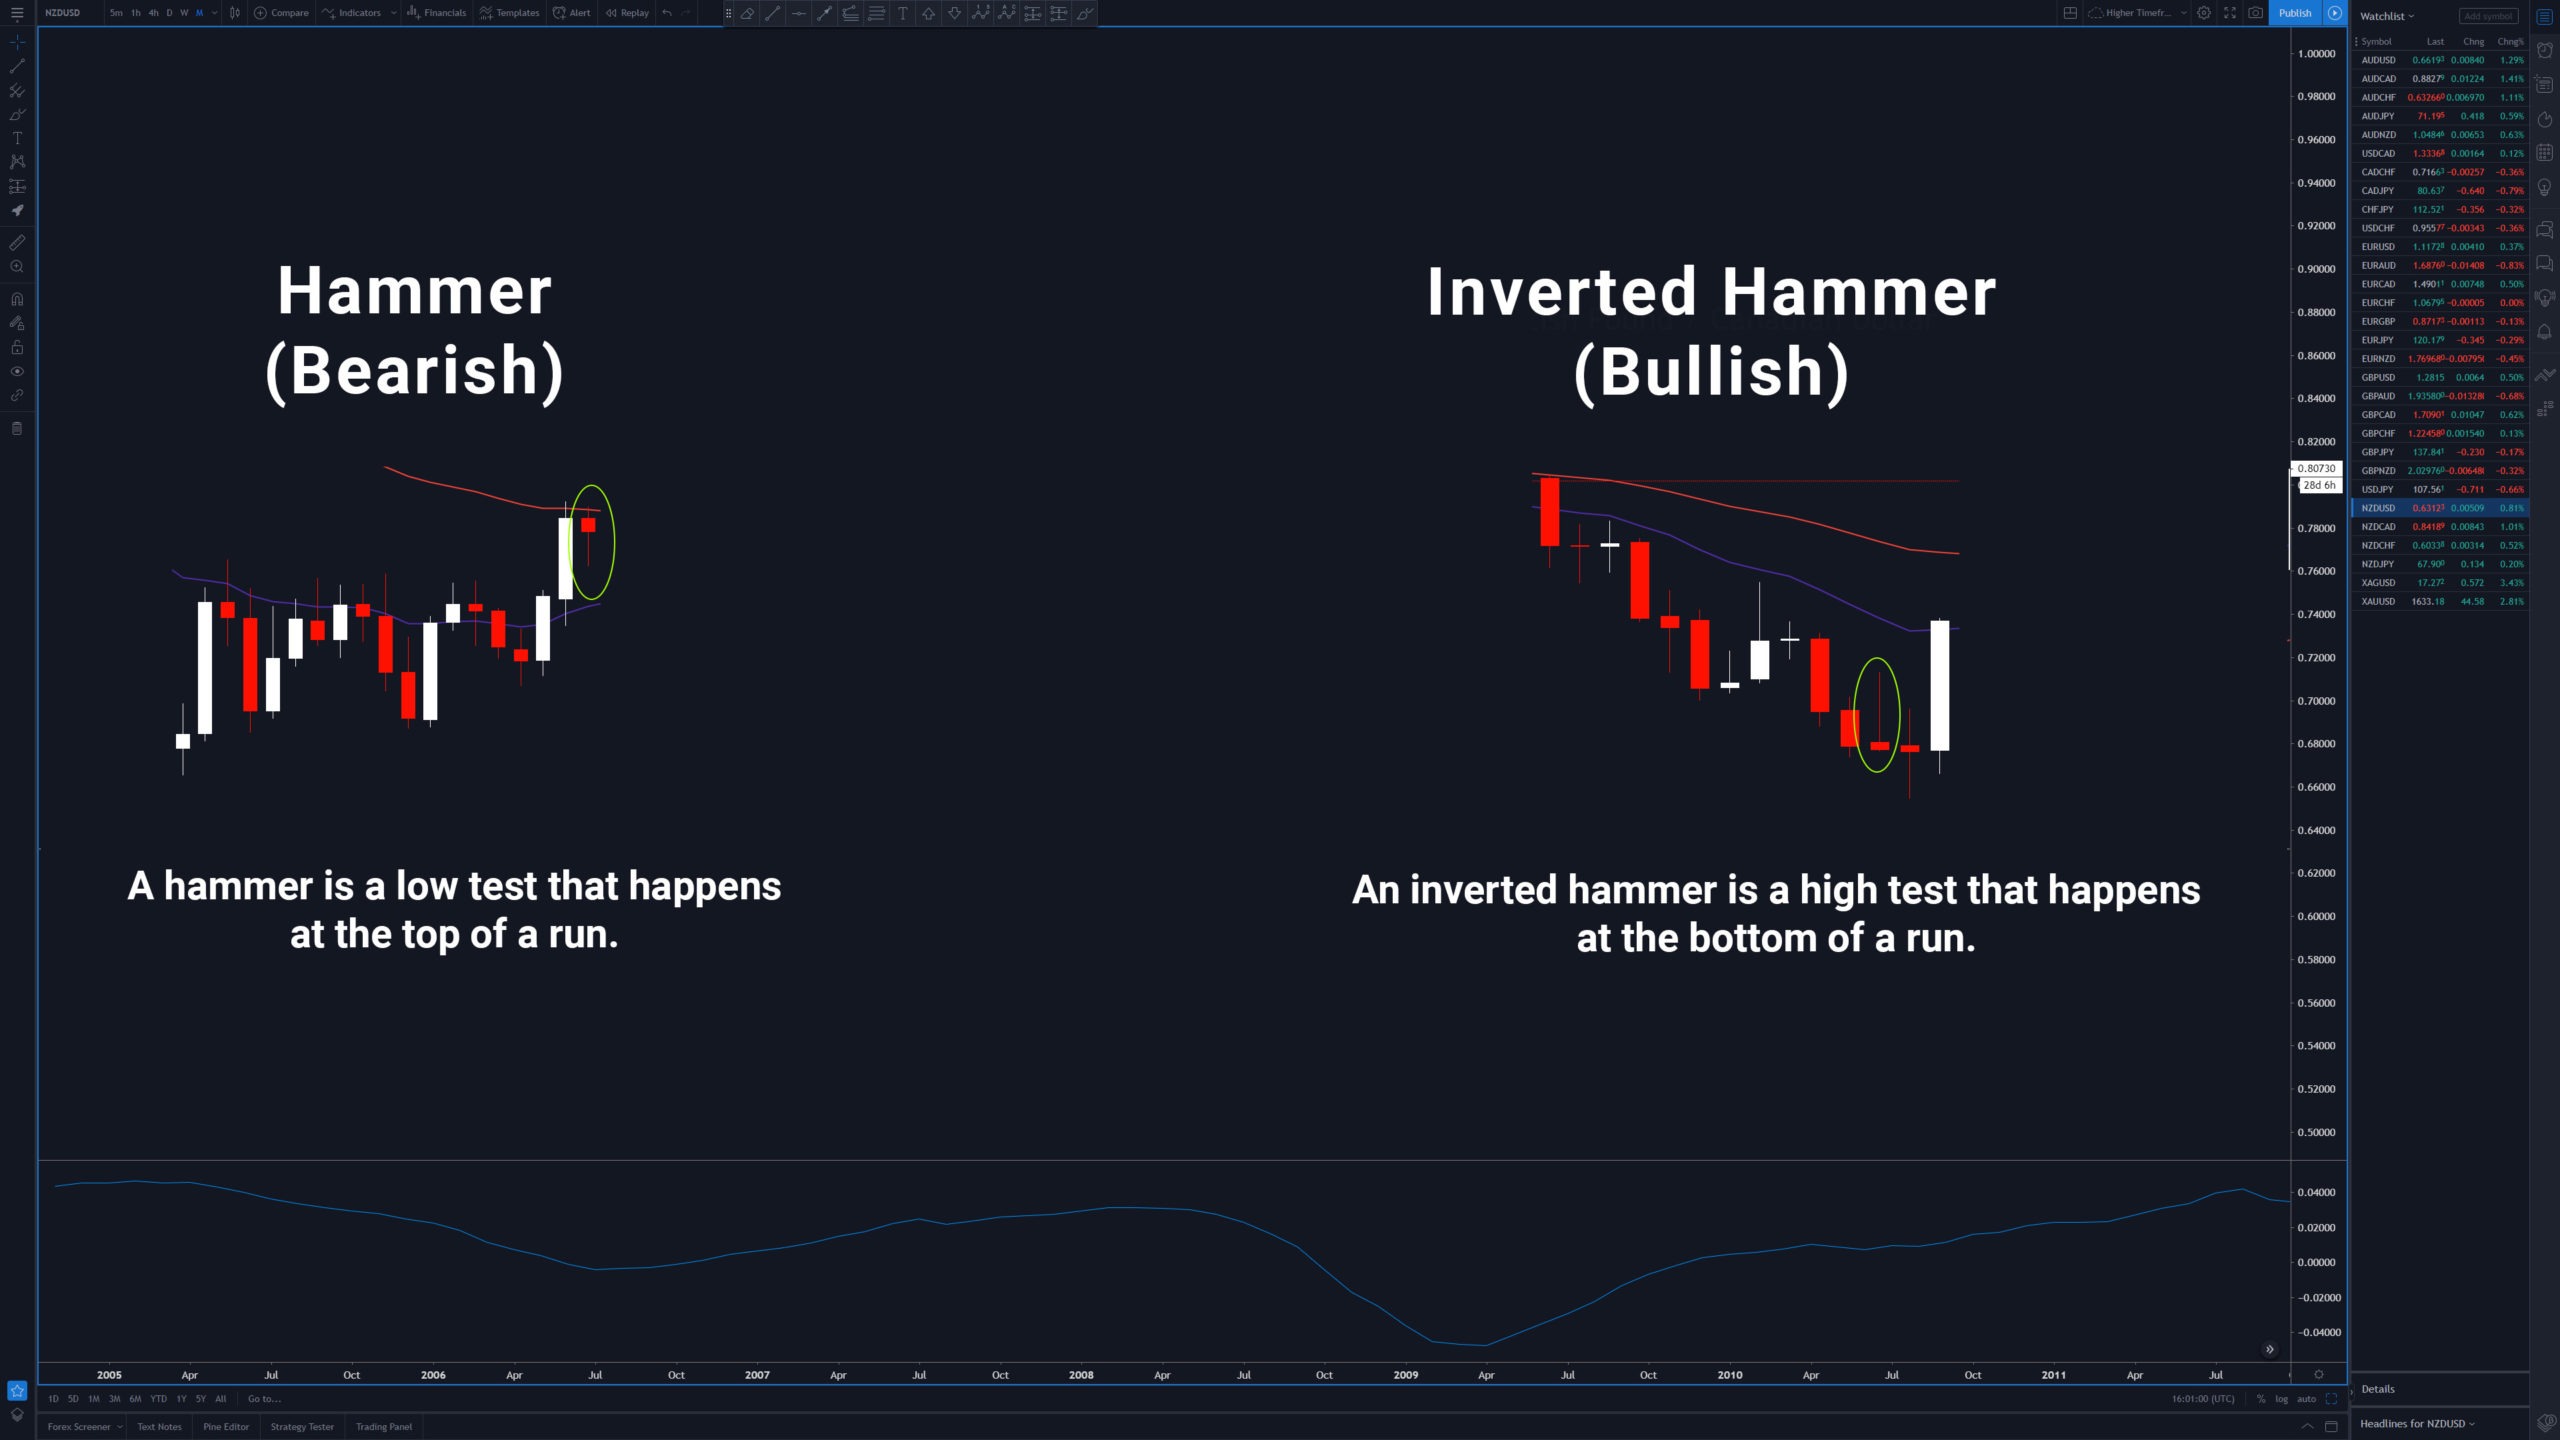
Hammer / inverted hammer
It's pretty much a low-test/high-test, but at a different place.
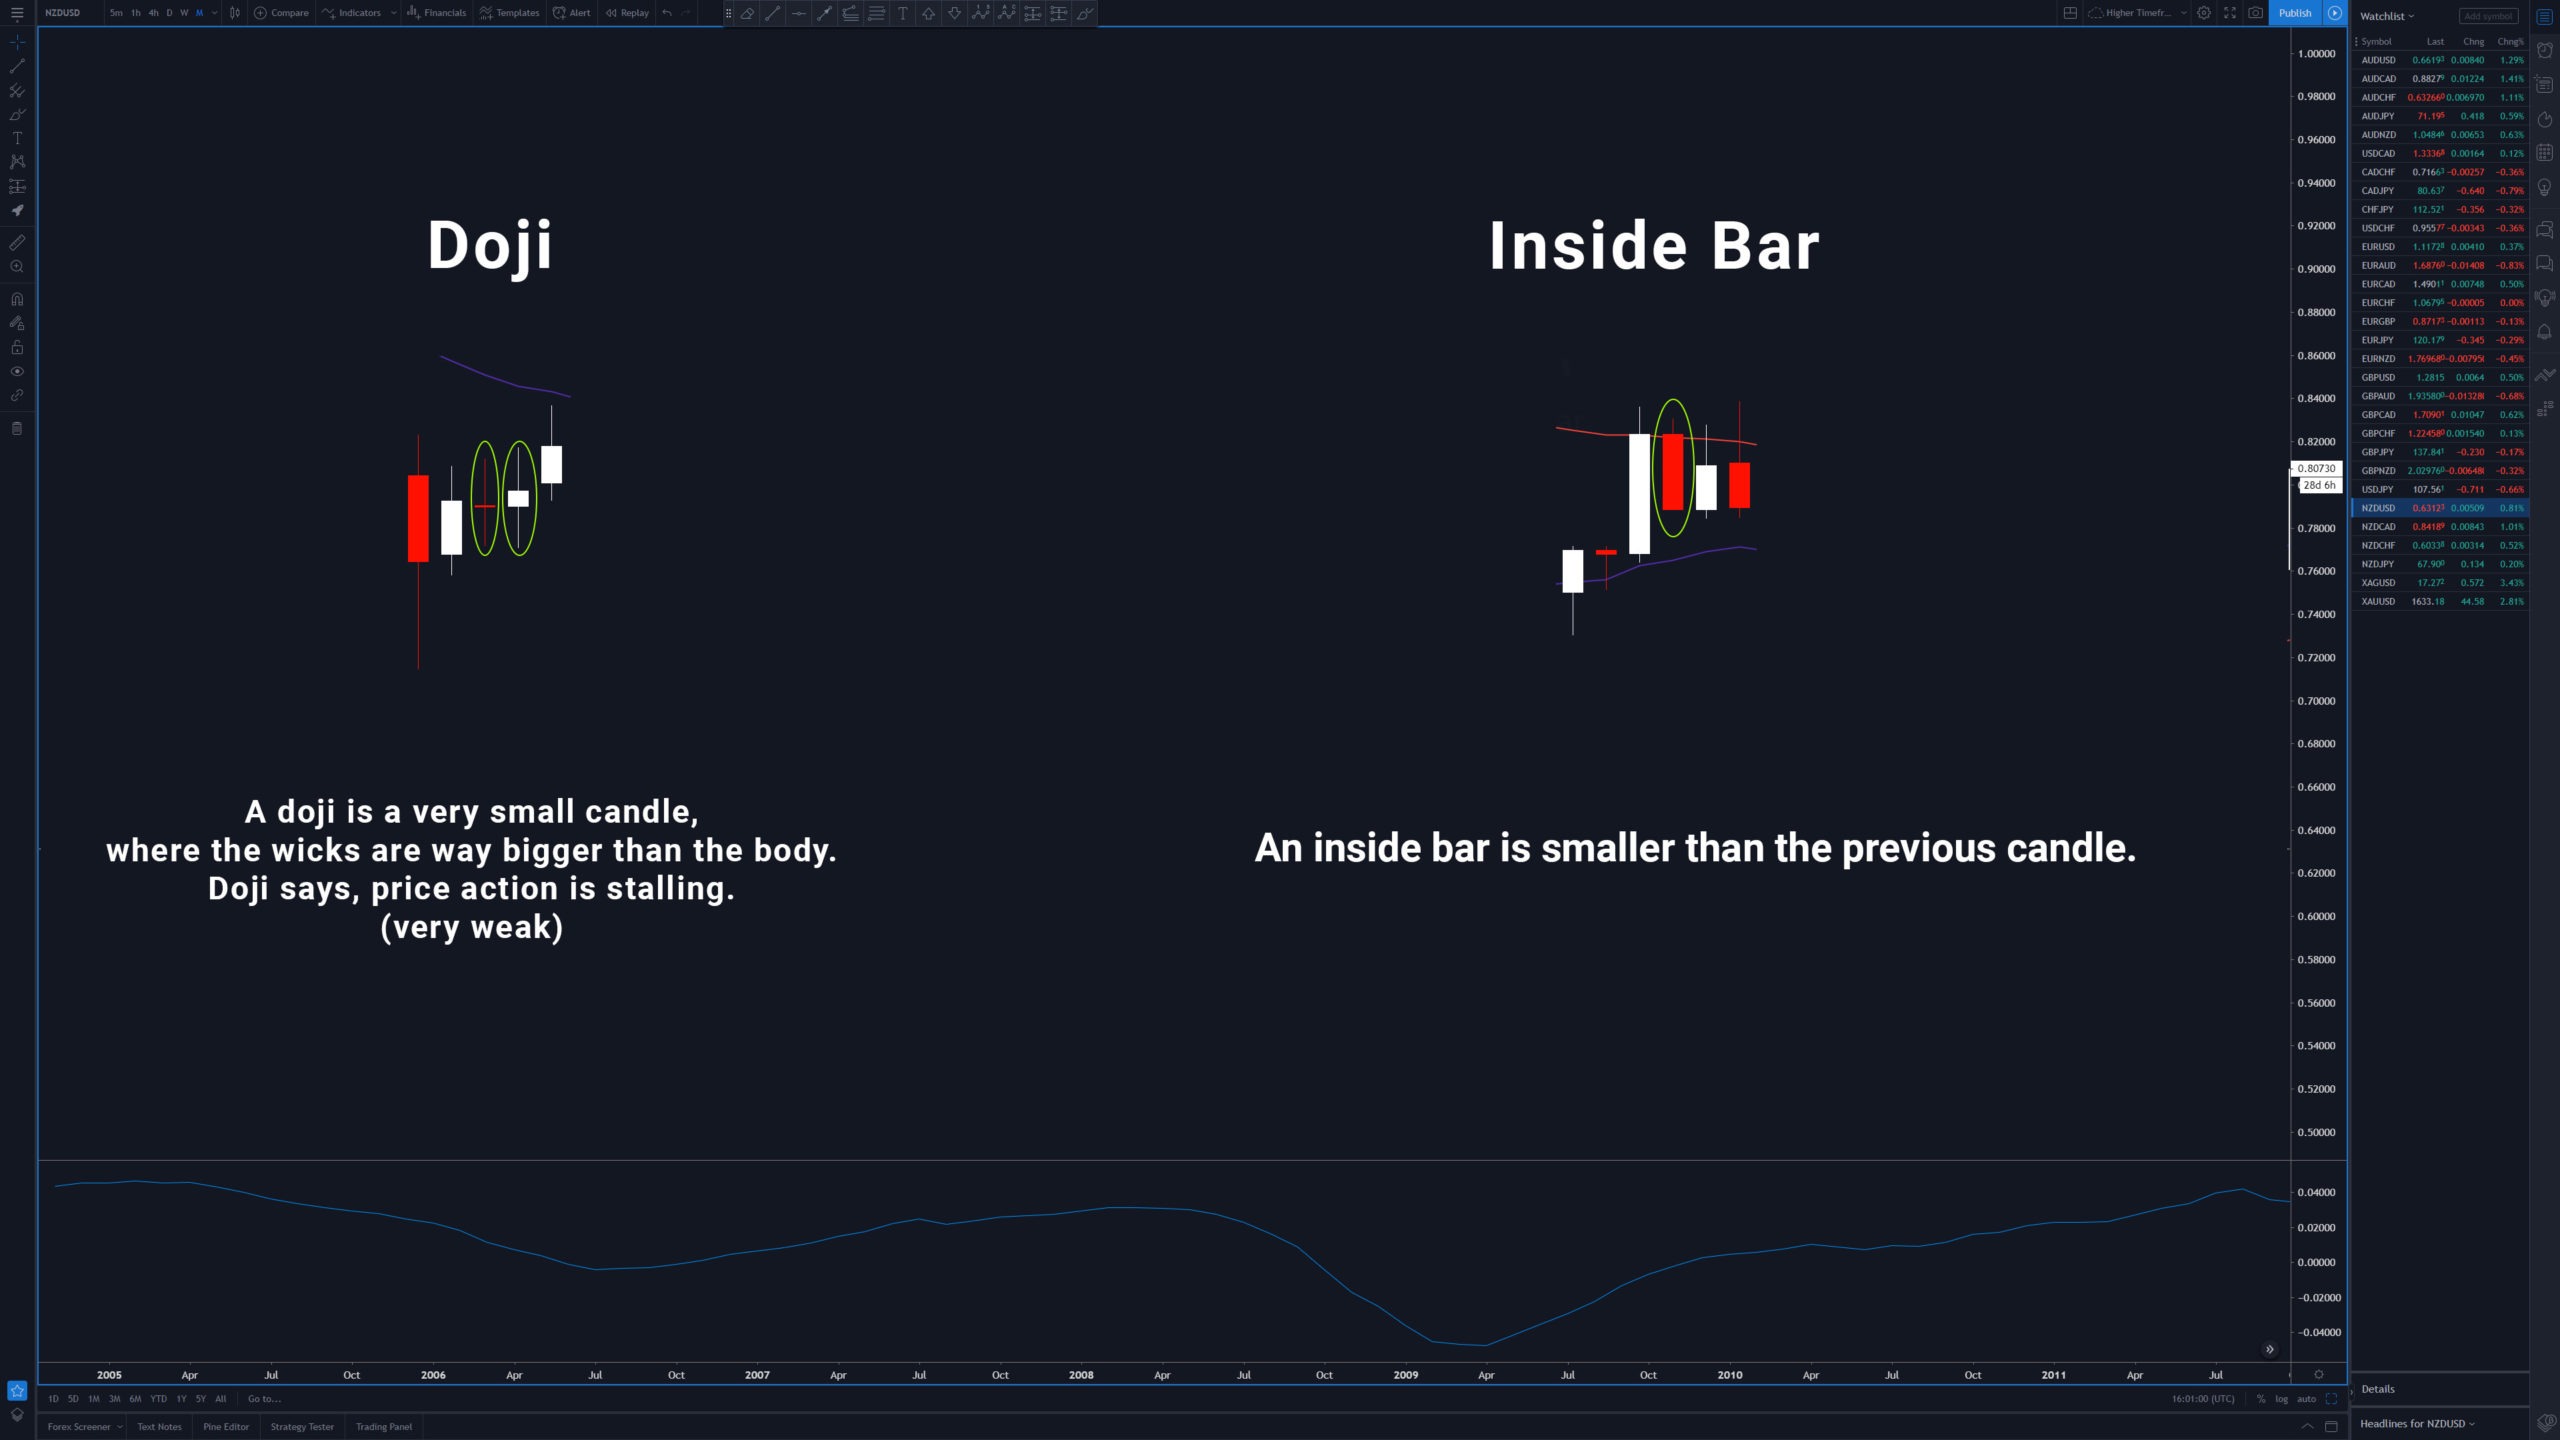
Doji and Inside Bar
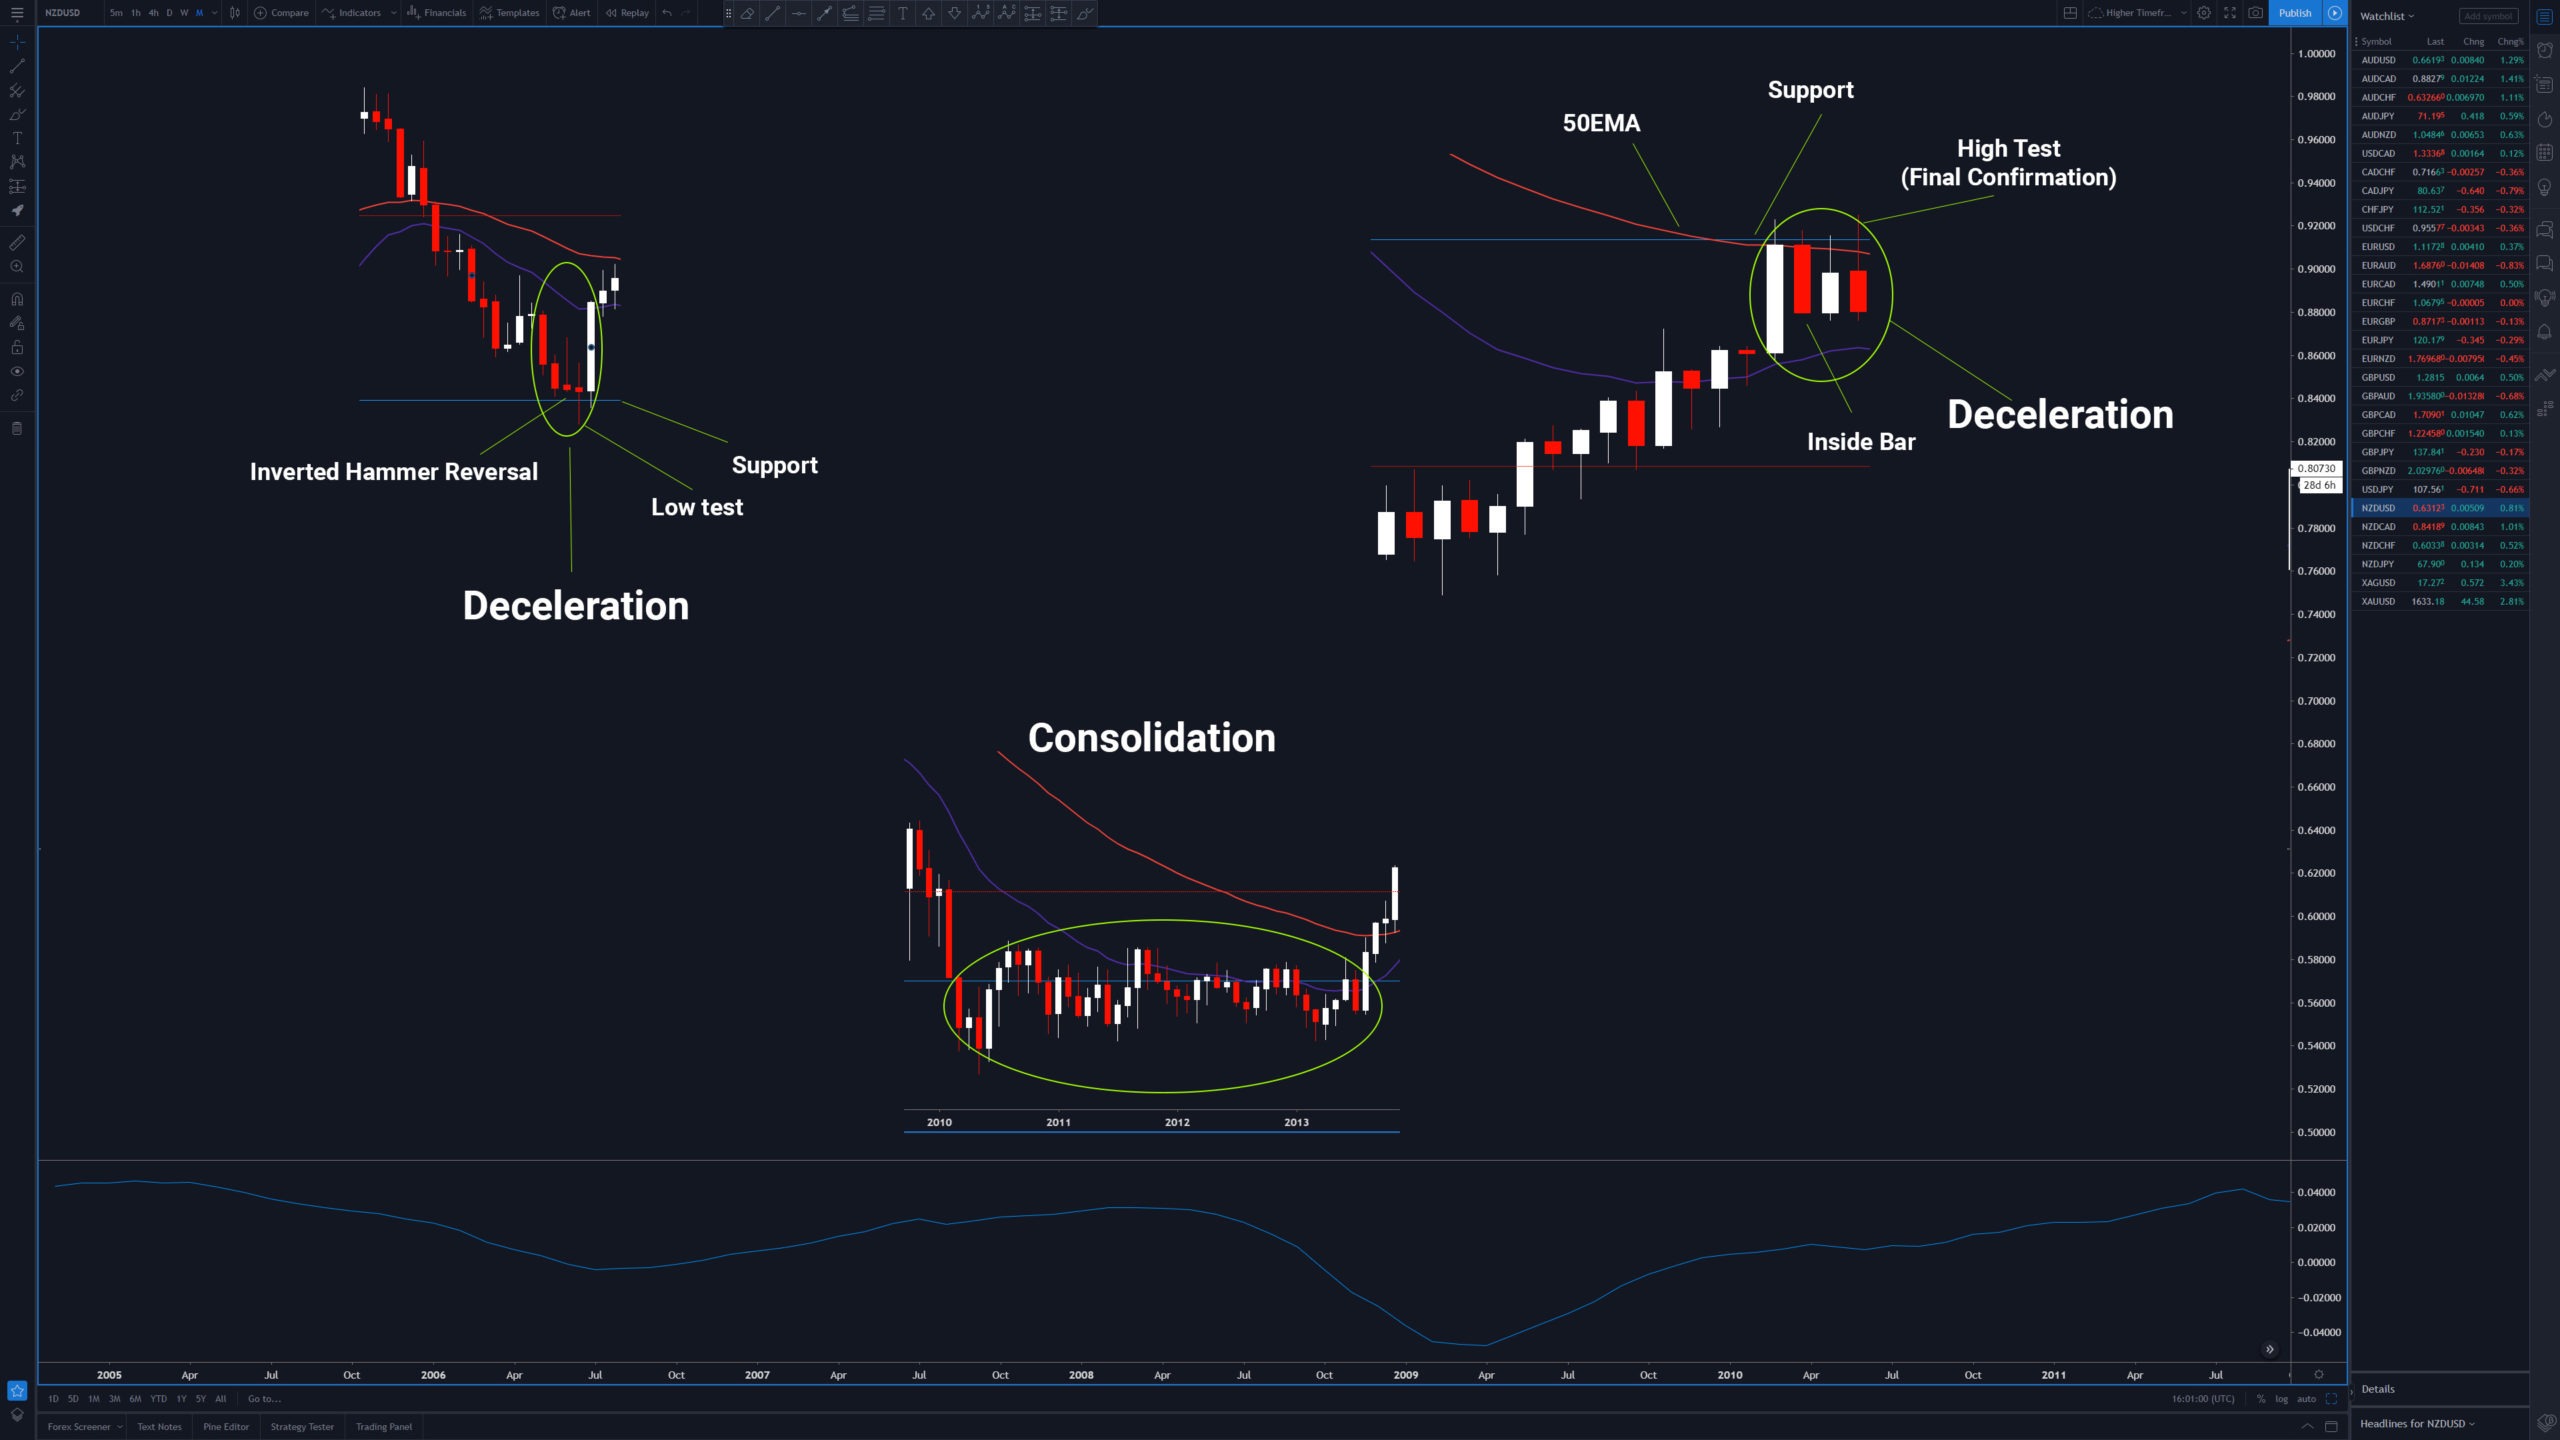
Deceleration & Consolidation
It’s very important to understand what deceleration is, and also what consolidation looks like. 9 times out of 10 we need some sort of deceleration to be present in the market before executing a trade… deceleration is a signal that price may be turning around (i.e. price was accelerating to the upside, but reached a support and resistance level such as a horizontal line, and then began to slow down, ‘decelerate’, and potentially reject that level).
On the other hand, when we are witnessing periods of consolidation in the market, we want to avoid executing trades. Consolidation is messy, sideways price action, signalling indecision. We don’t want to trade during periods of consolidation, instead, we want to wait for a clear breakout above or below the sideways price action.
Deceleration has to hit a resistance/support level and will usually have a reversal candlestick formation at the end.
Deceleration starts out with a big candle and then gets smaller and smaller as we approach a resistance/support level.
Deceleration might turn into consolidation. Consolidation looks messy, while deceleration looks clean and simple.
Deceleration can last anywhere from a day to 5 days on a daily. On other timeframes it is around 2-5 candles usually.
If it runs longer, it is probably a consolidation.
Consolidation is indecision in the market.
Market Conditions
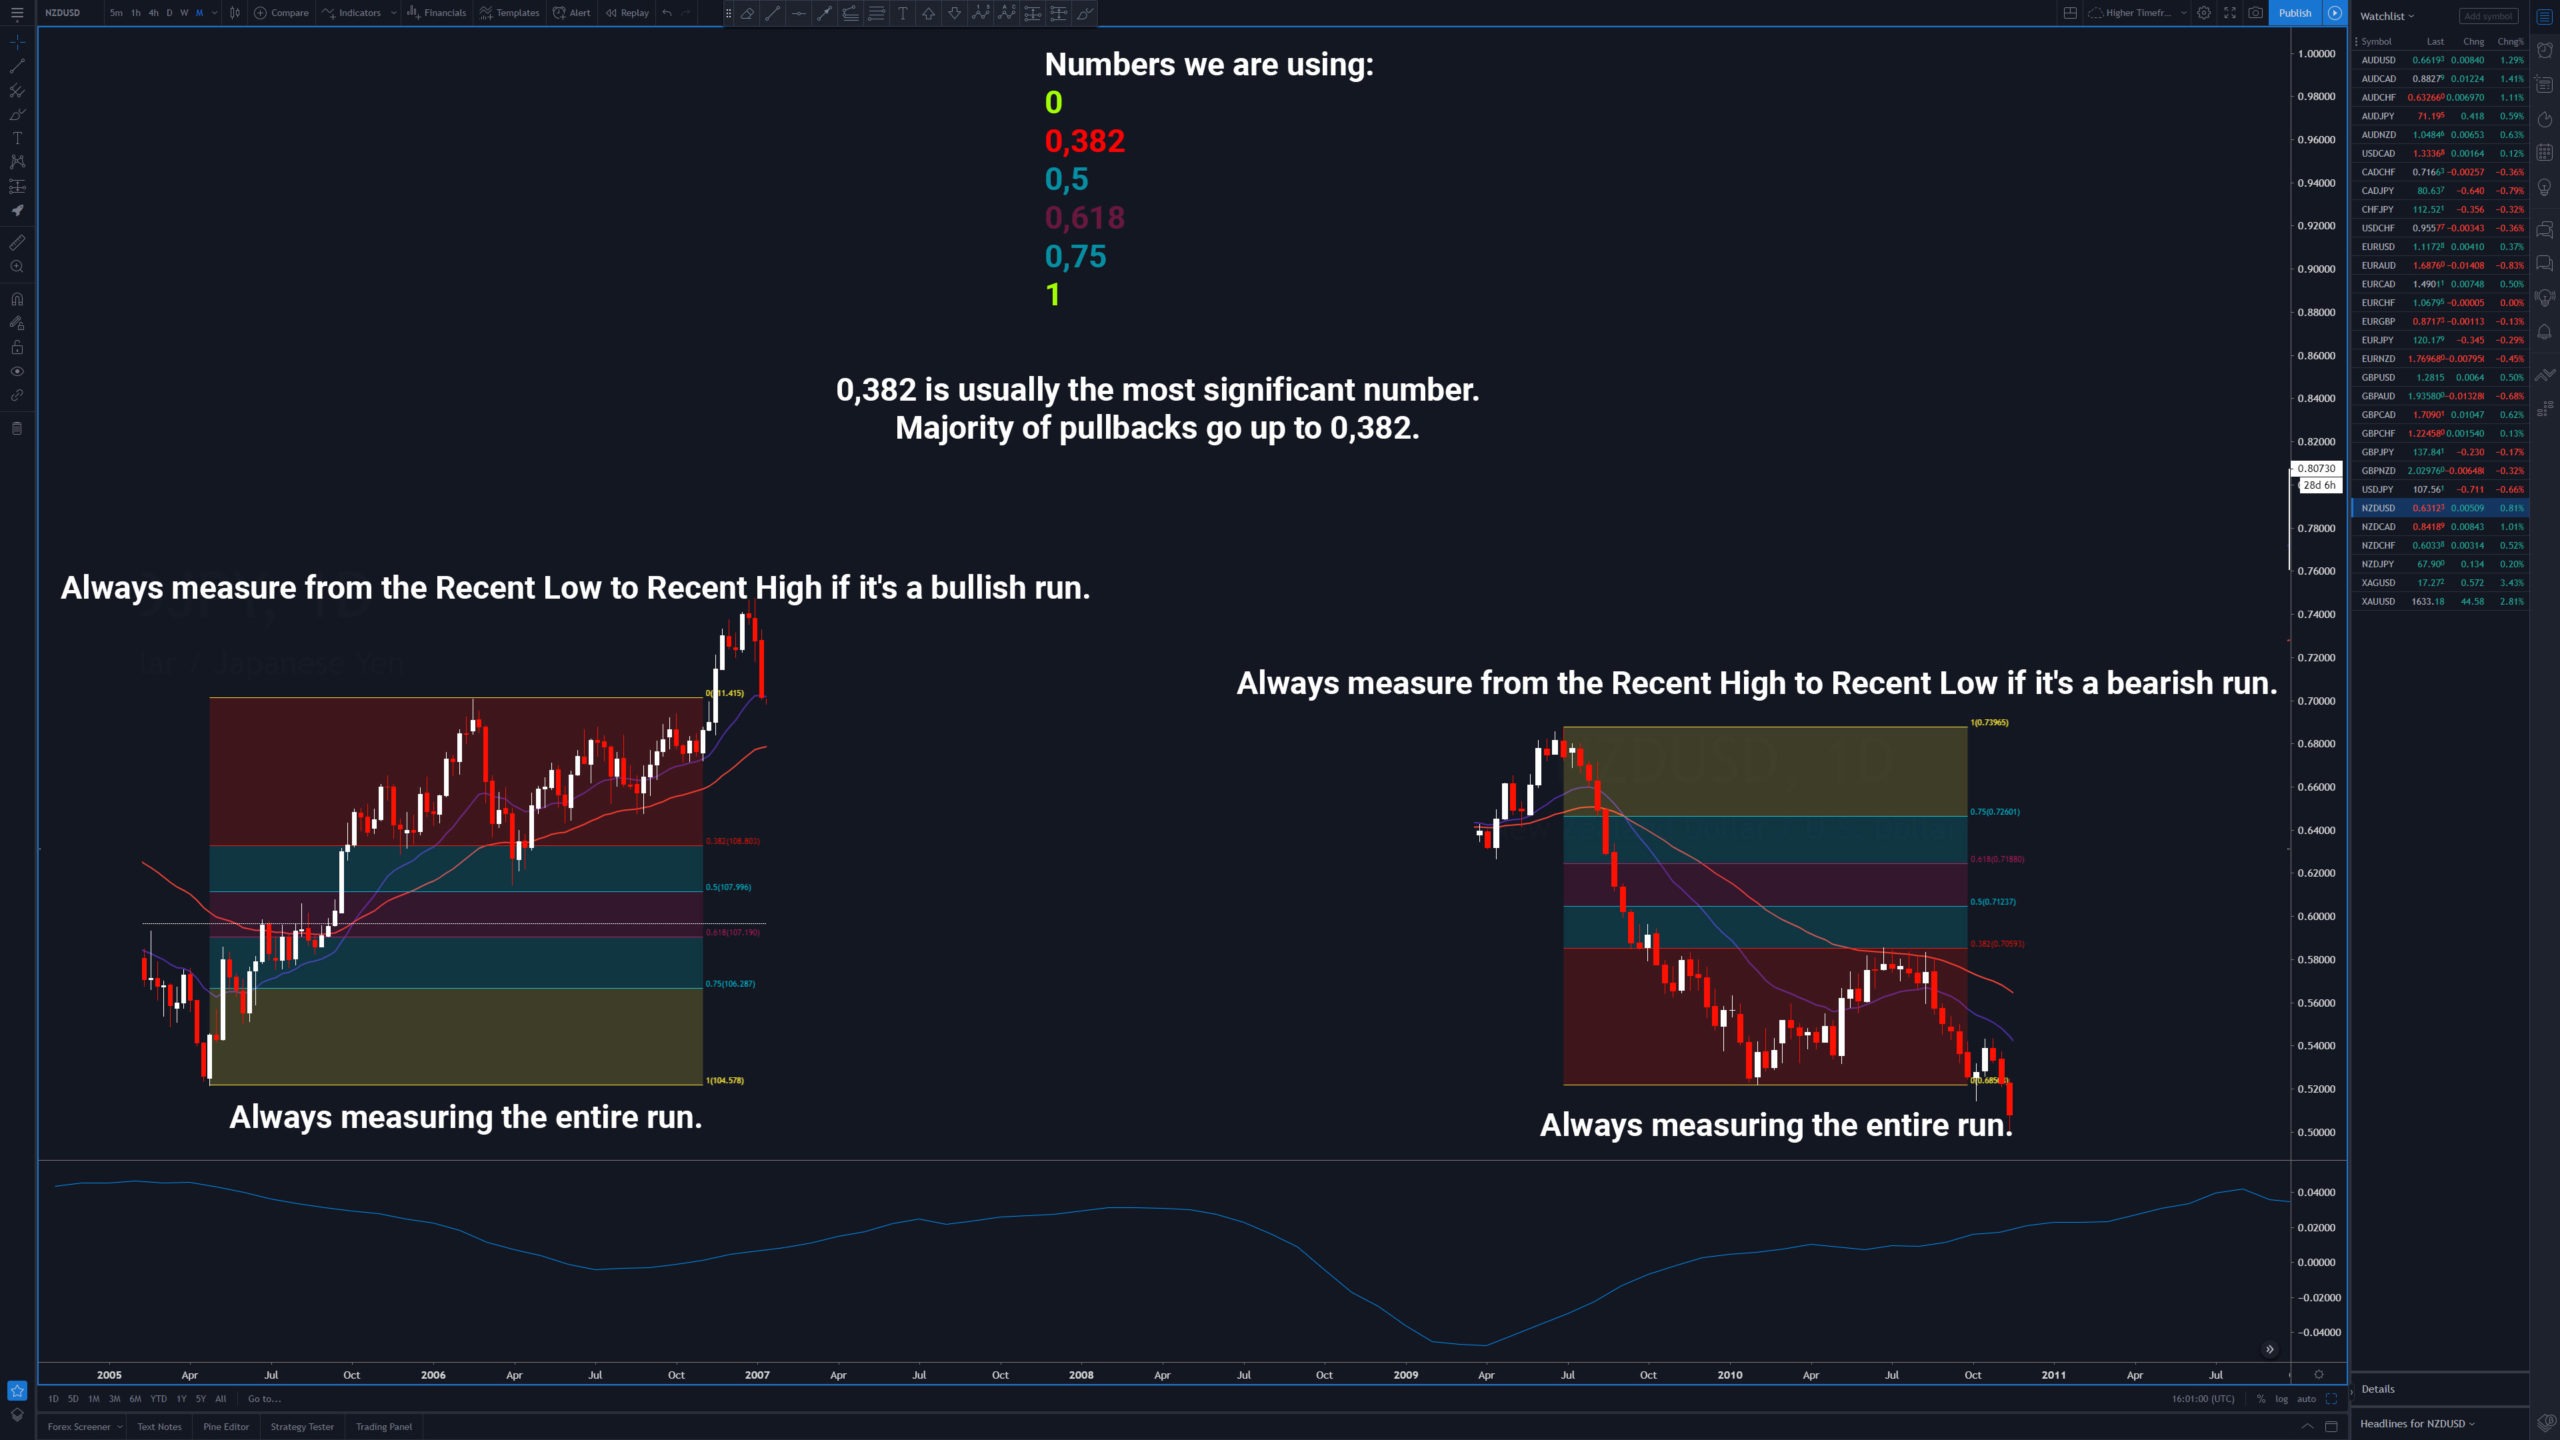
Fibonacci Retracement
The Fibonacci Retracement tool measures the potential pullback within a run.
It is something that you will utilize in your analysis every day. It’s used for planning entries, stops and even targets.
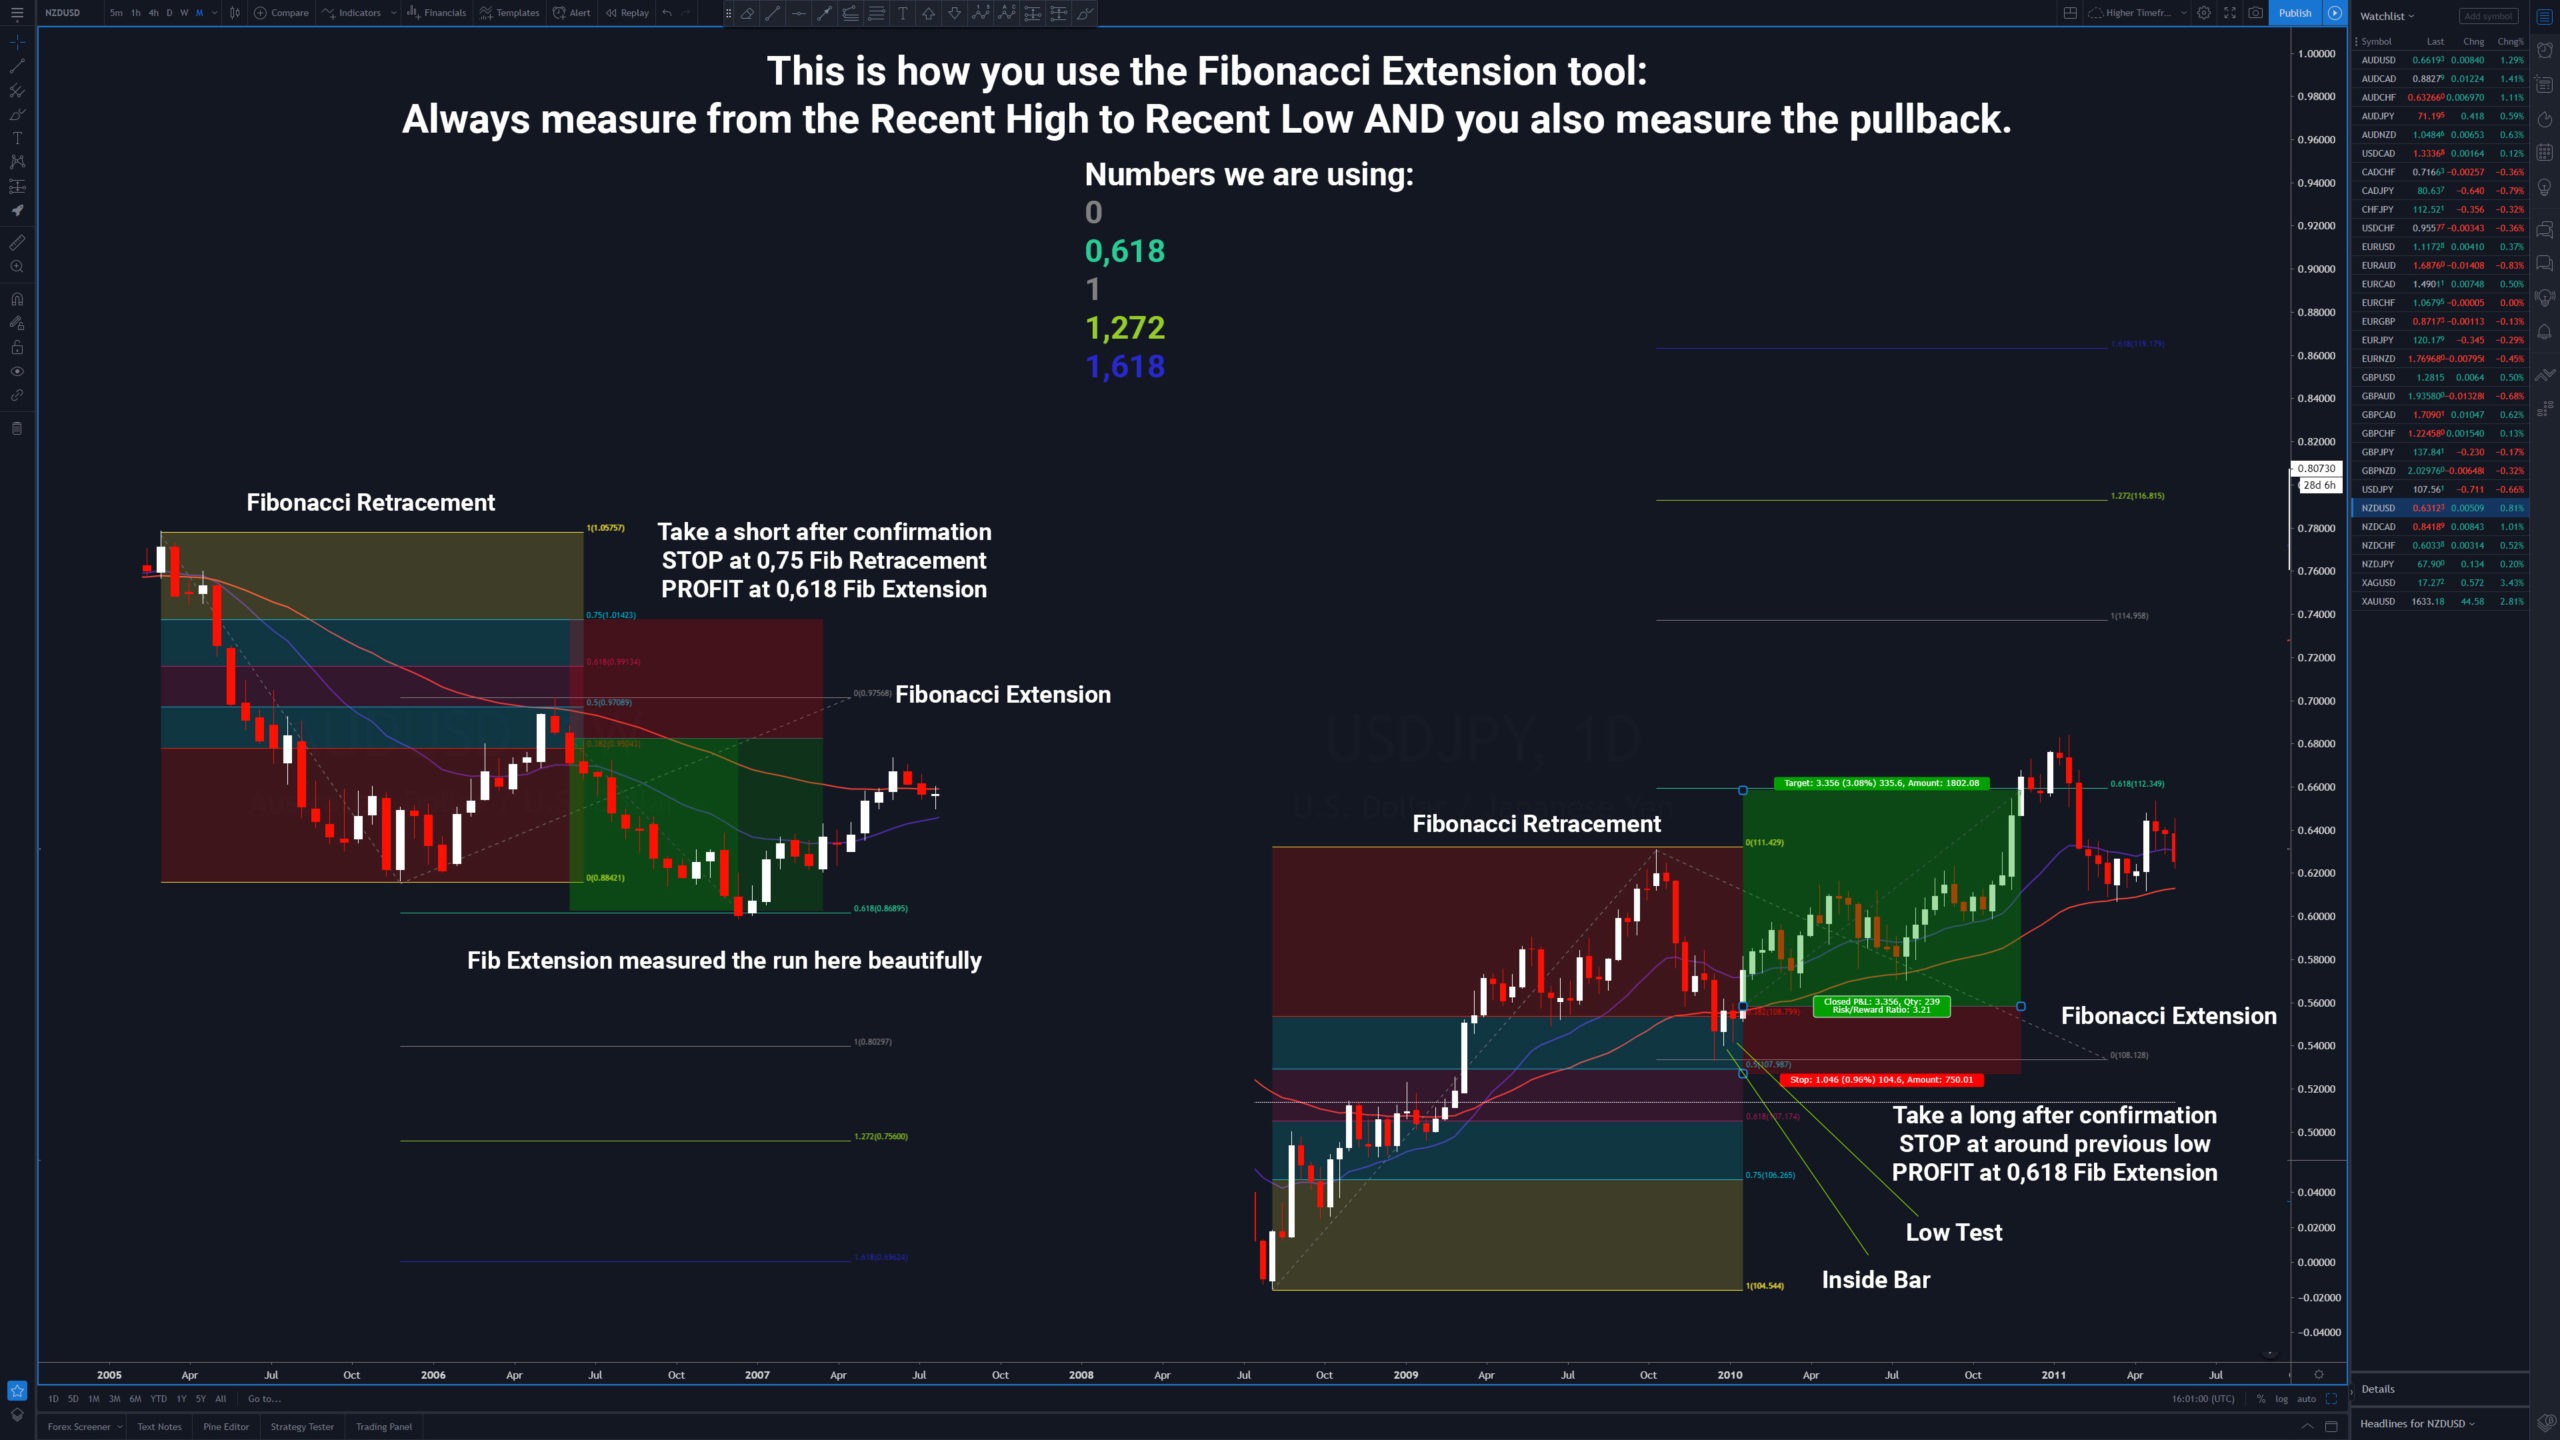
Fibonacci Extension ezt újranézni és javítani. nincs 0 vszeg
The Fibonacci Extension tool is utilized to measure the actual run within a trending market (as opposed to the retracement tool, which measures the pullback).
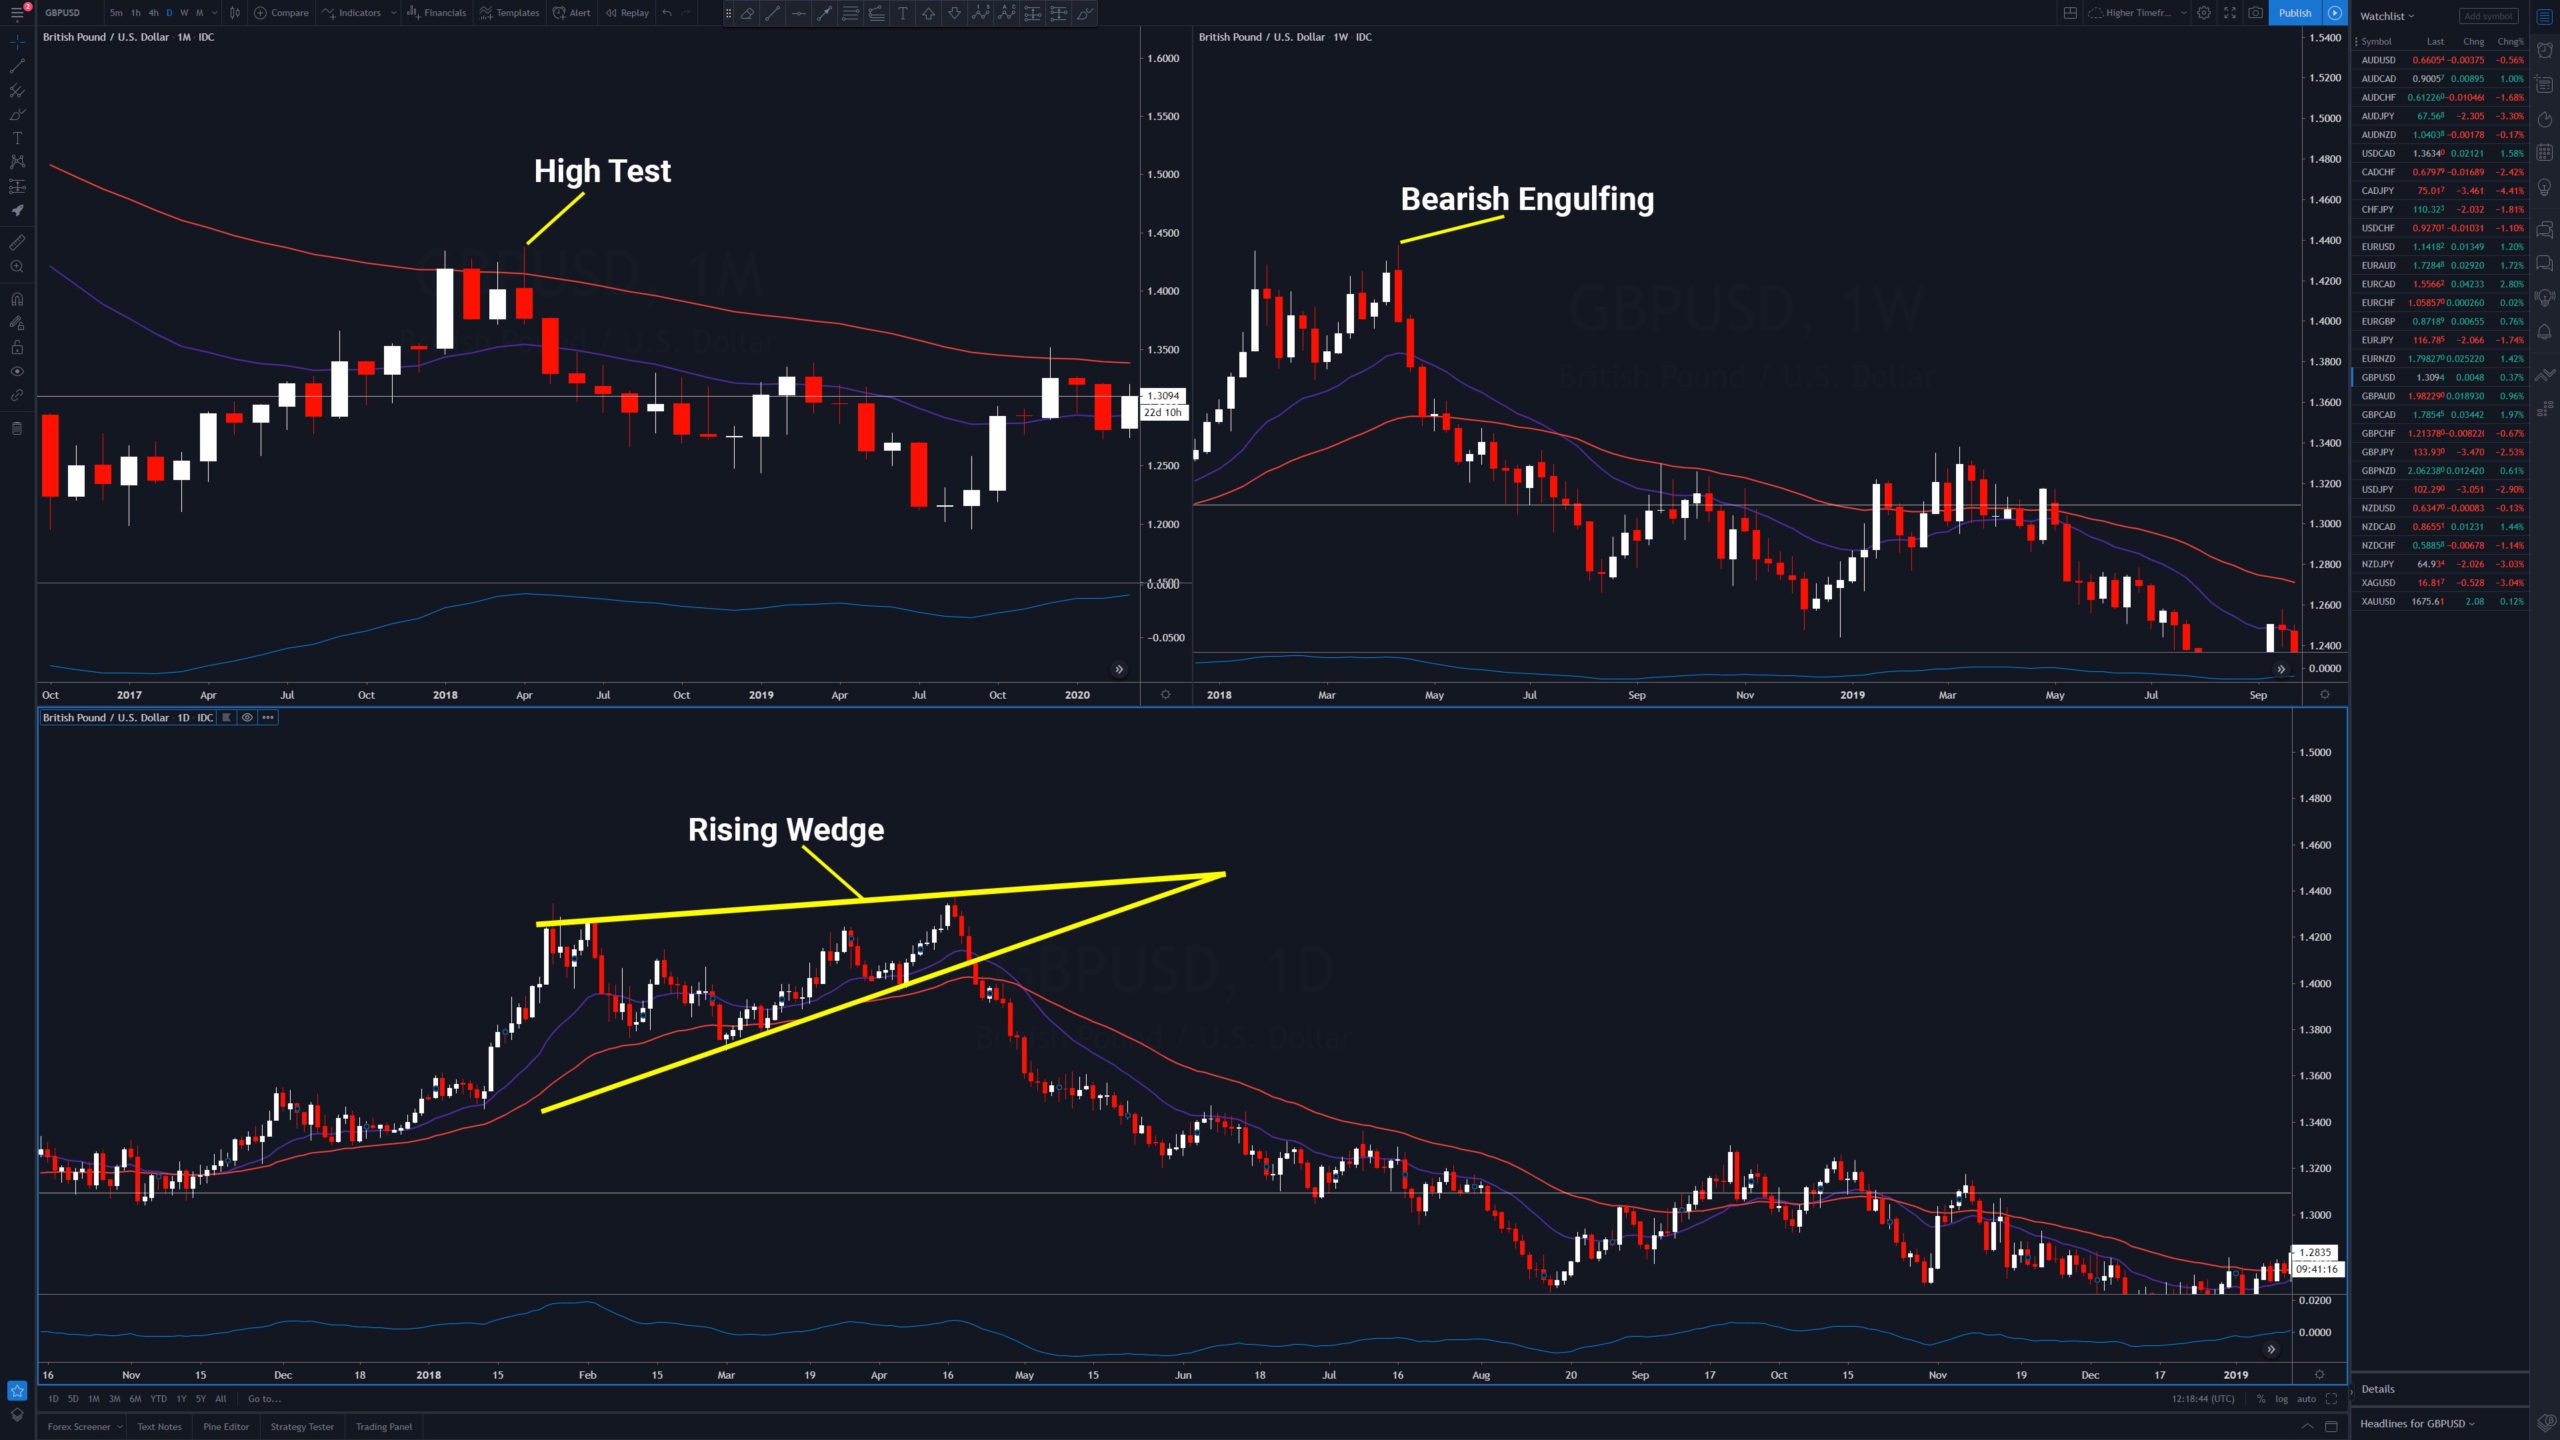
5. Price Action Patterns
Triangles
Head & Shoulders
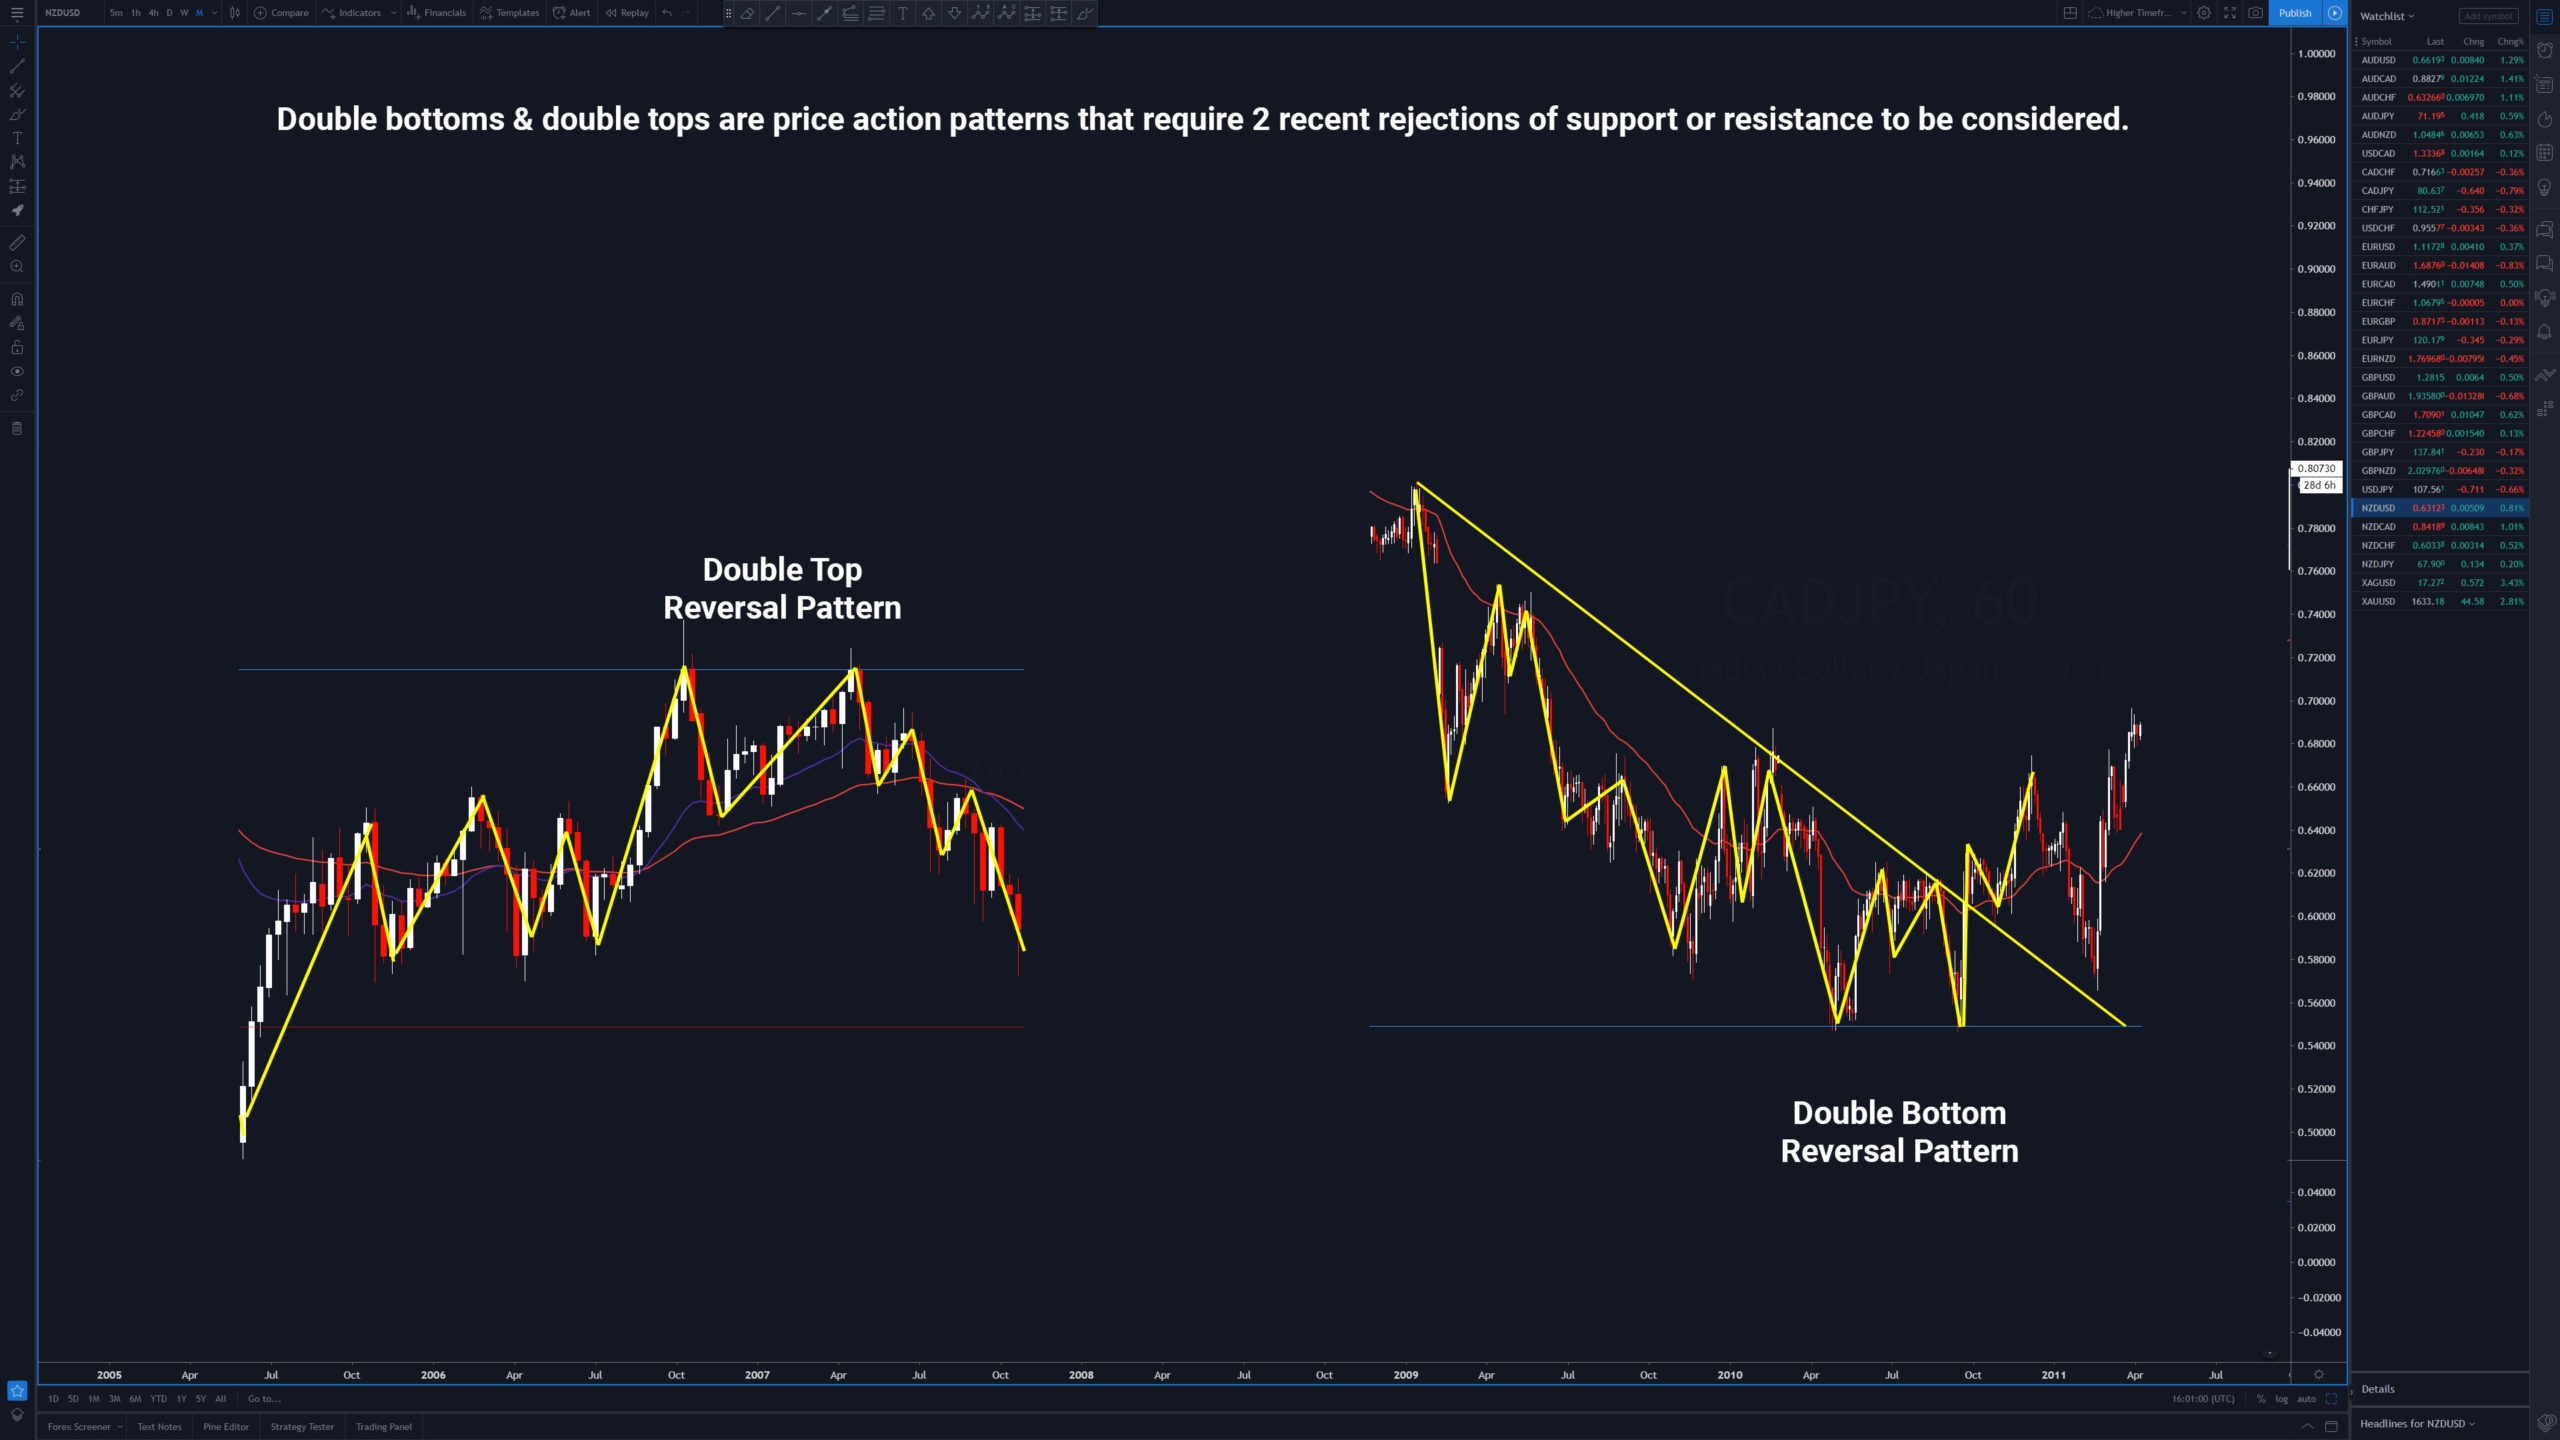
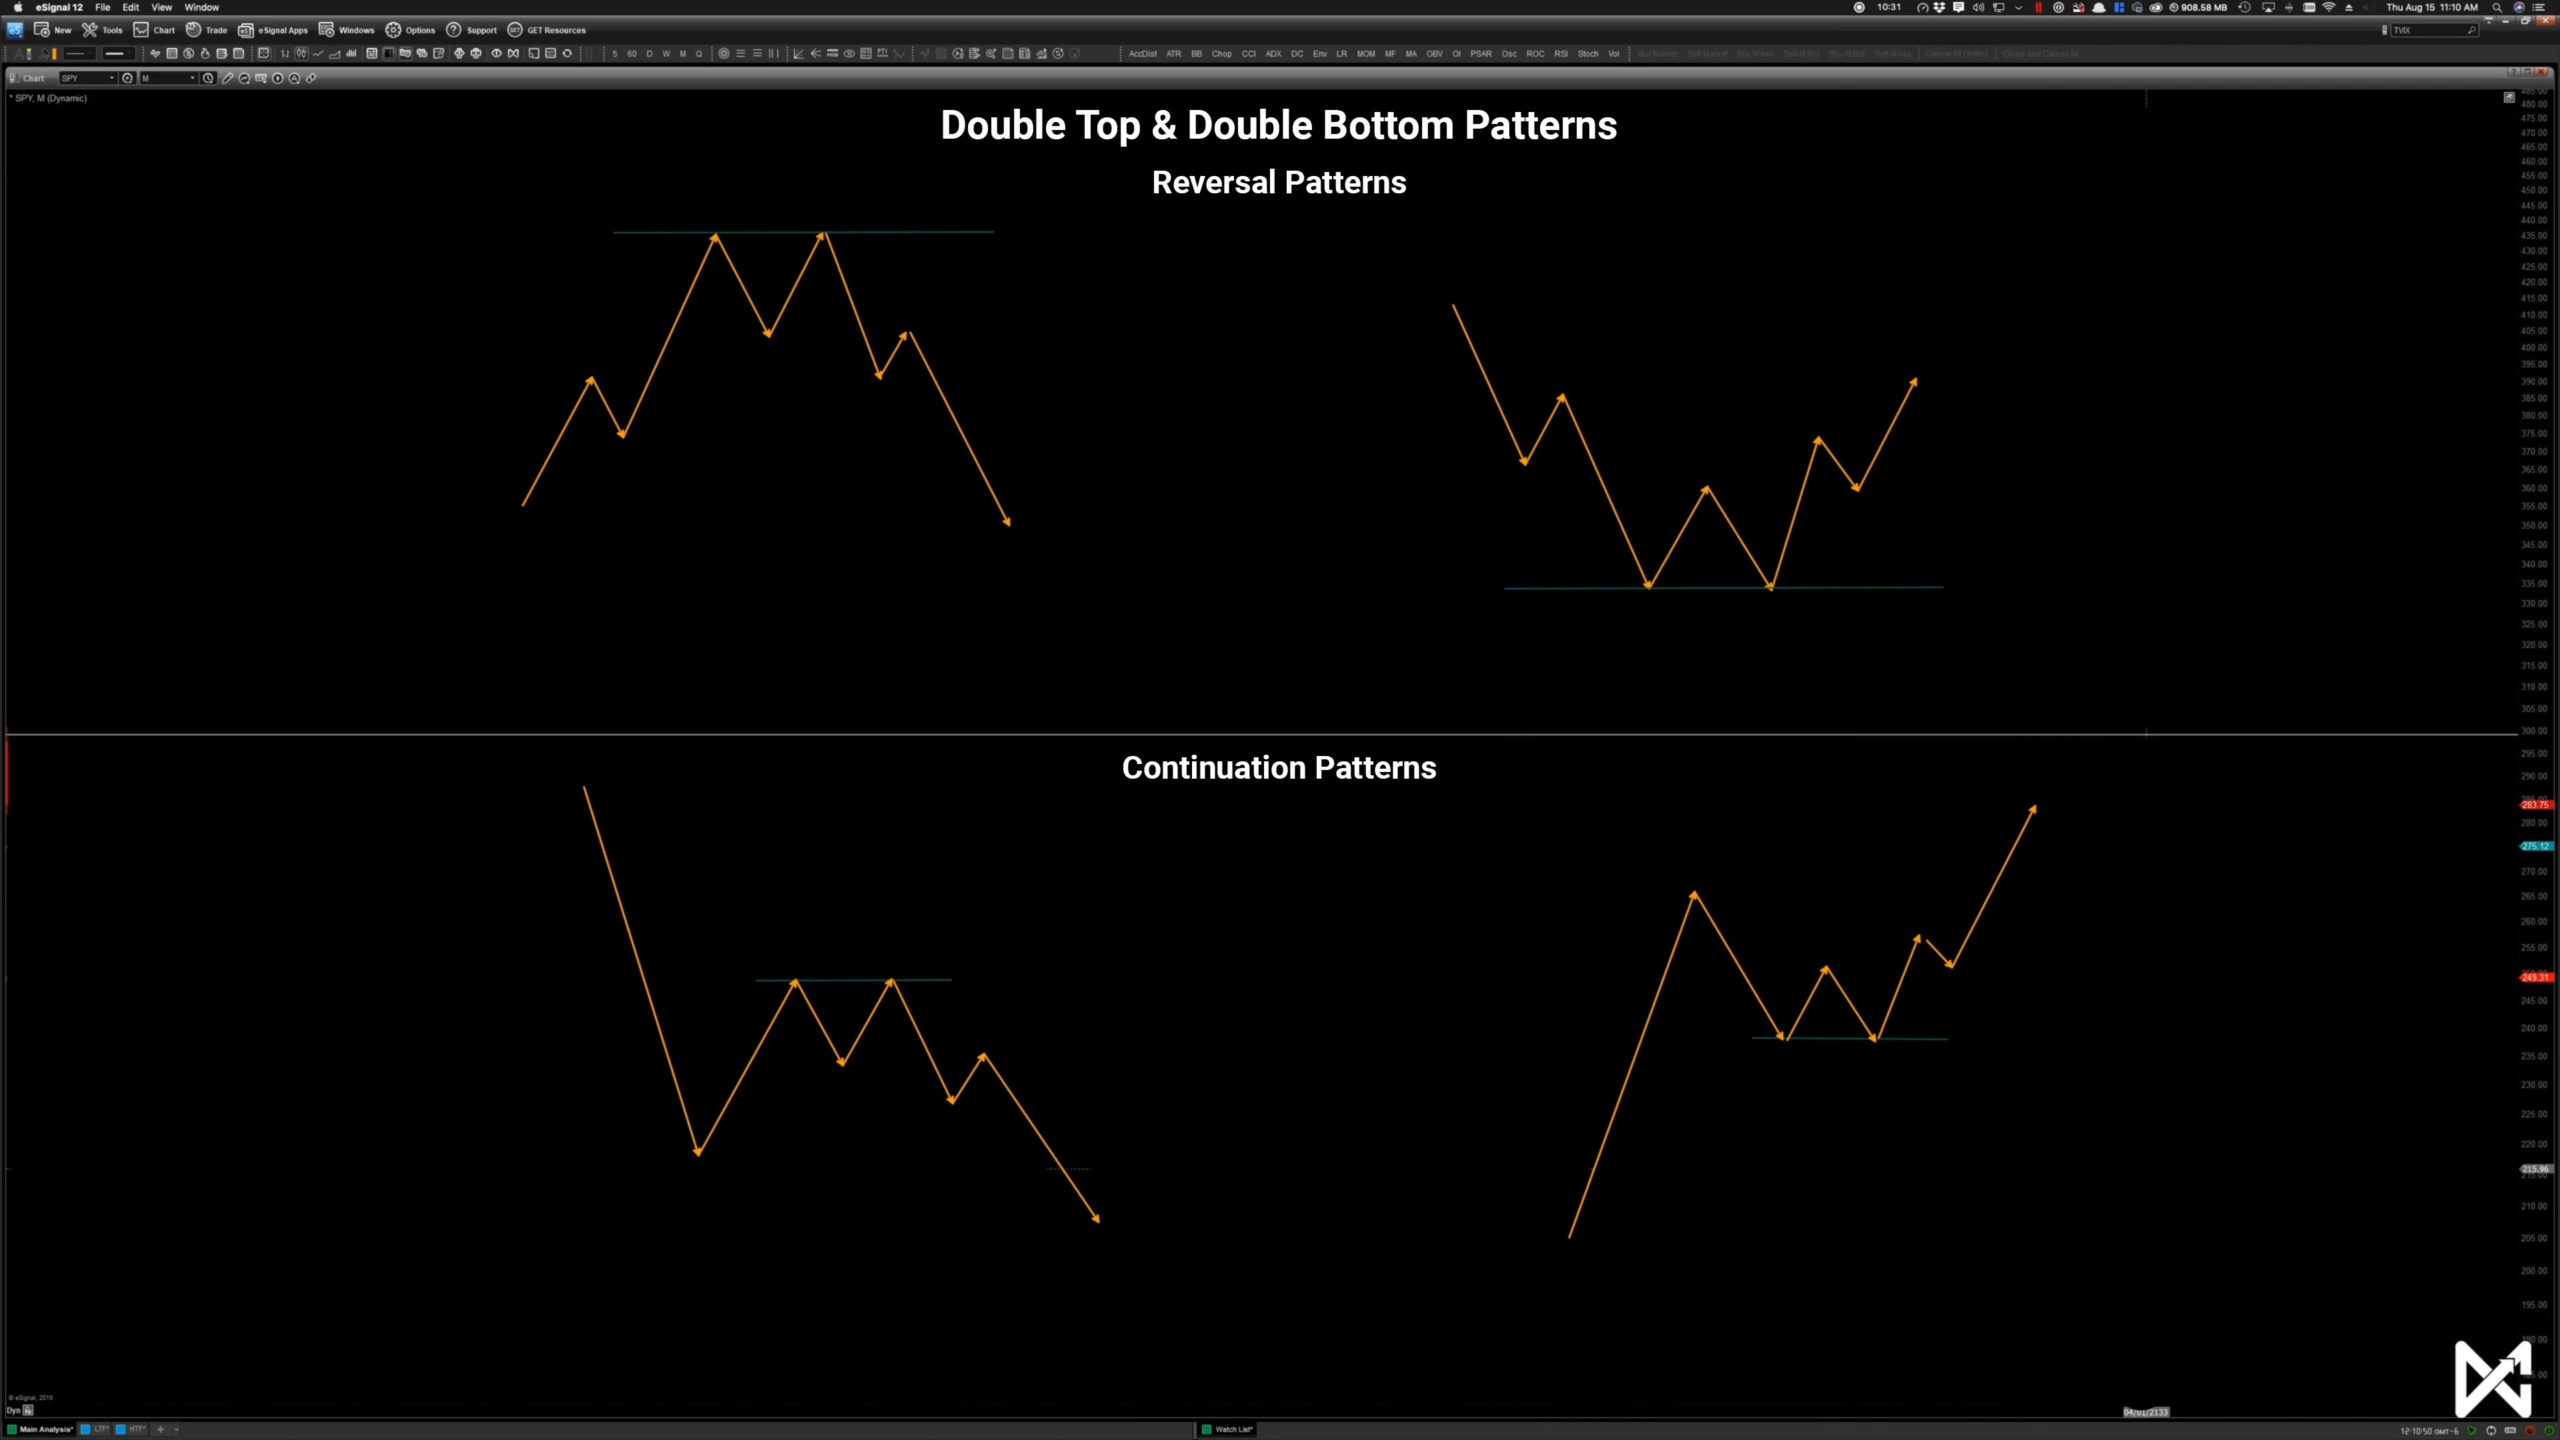
Double Top & Double Bottom
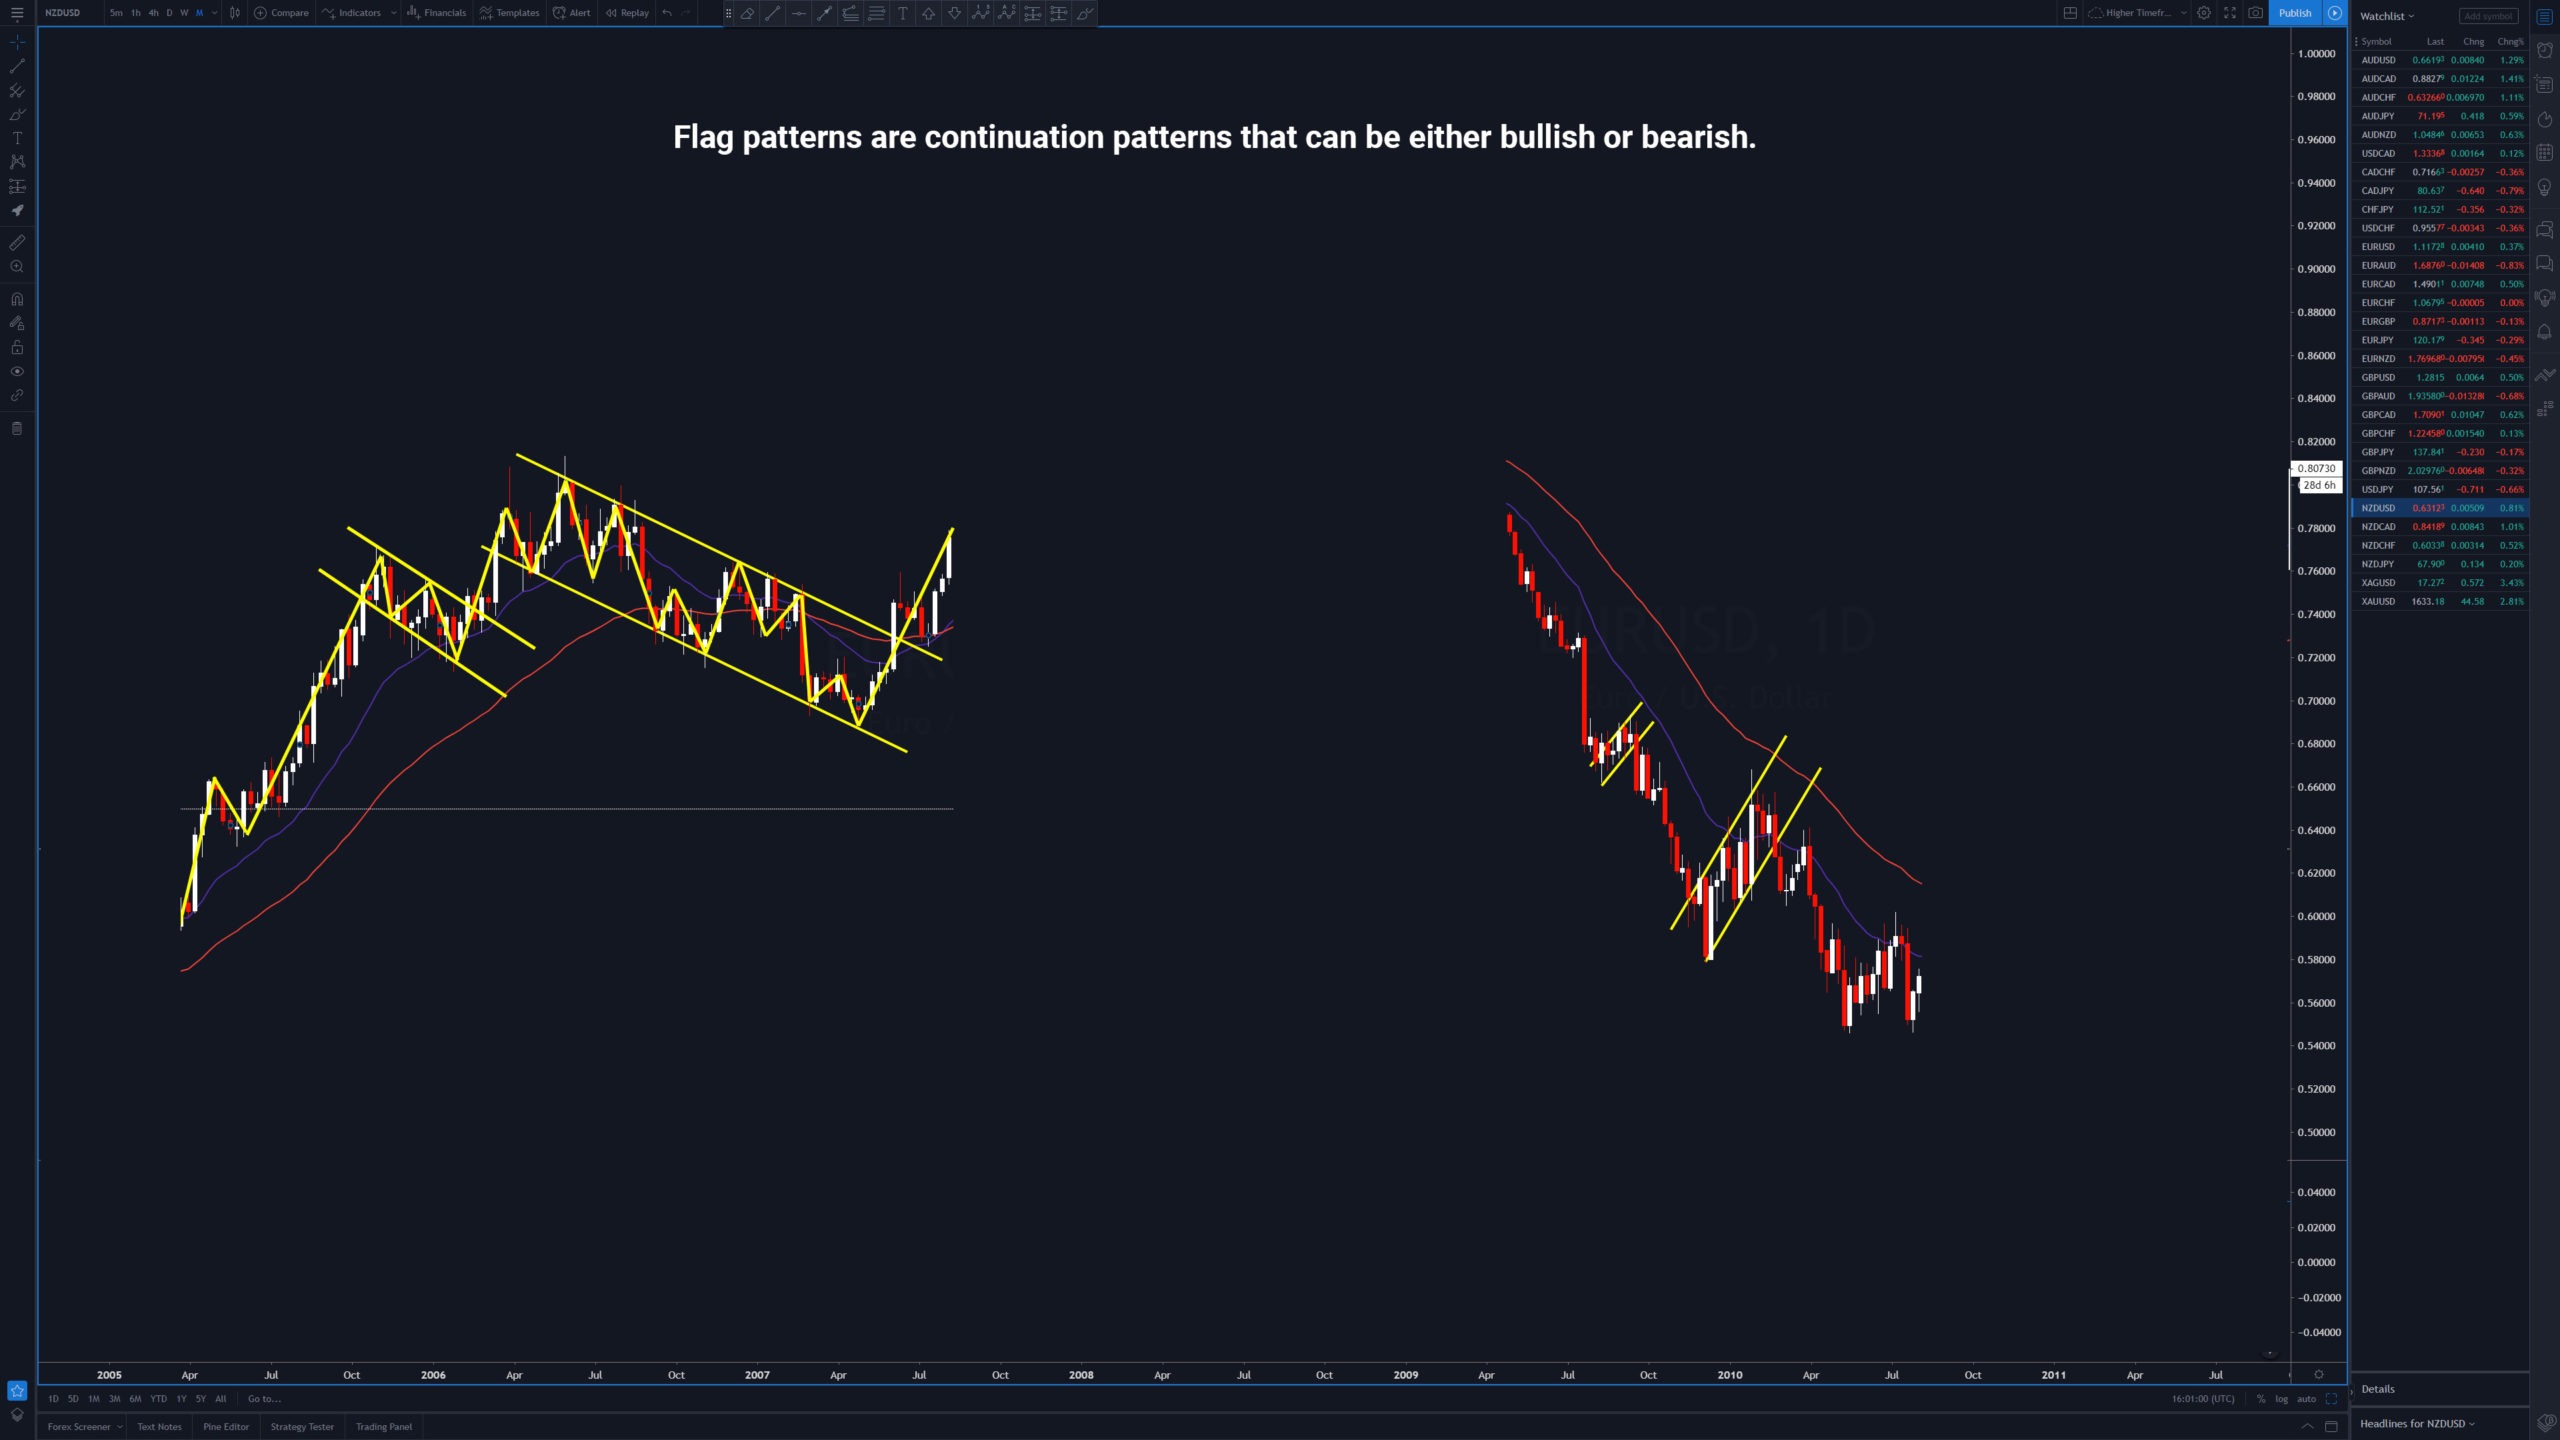
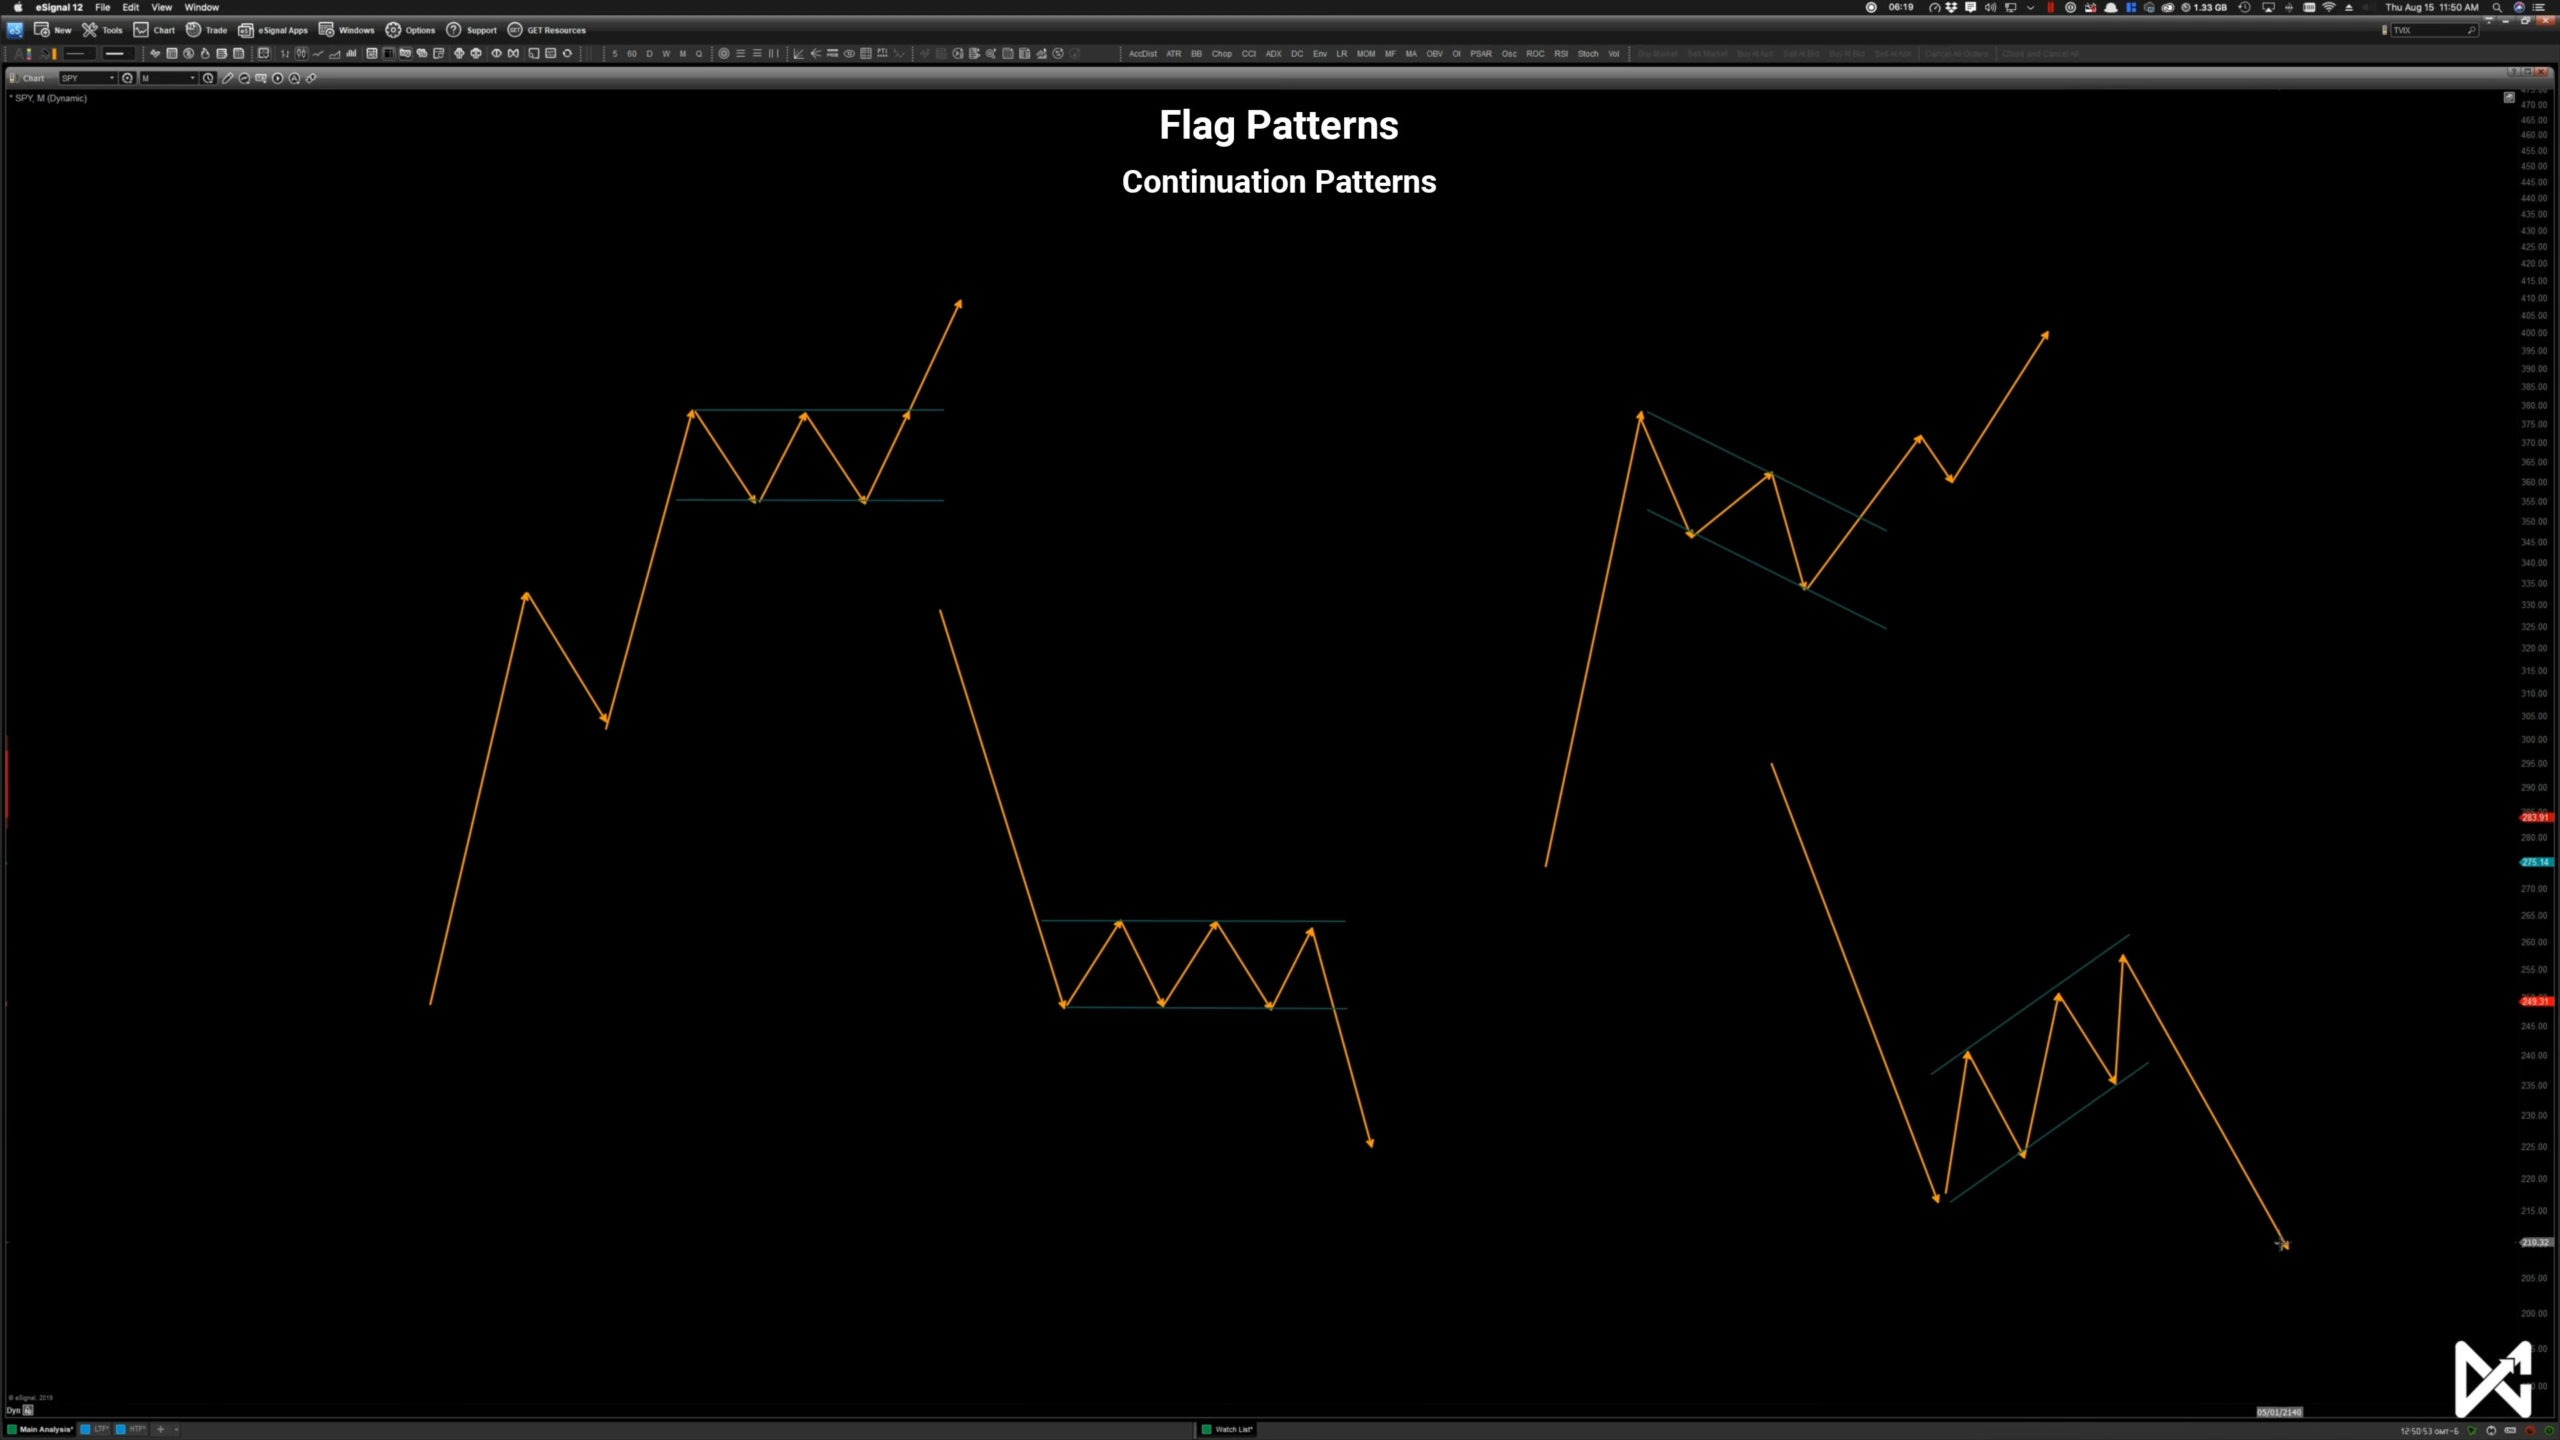
Flag Patterns
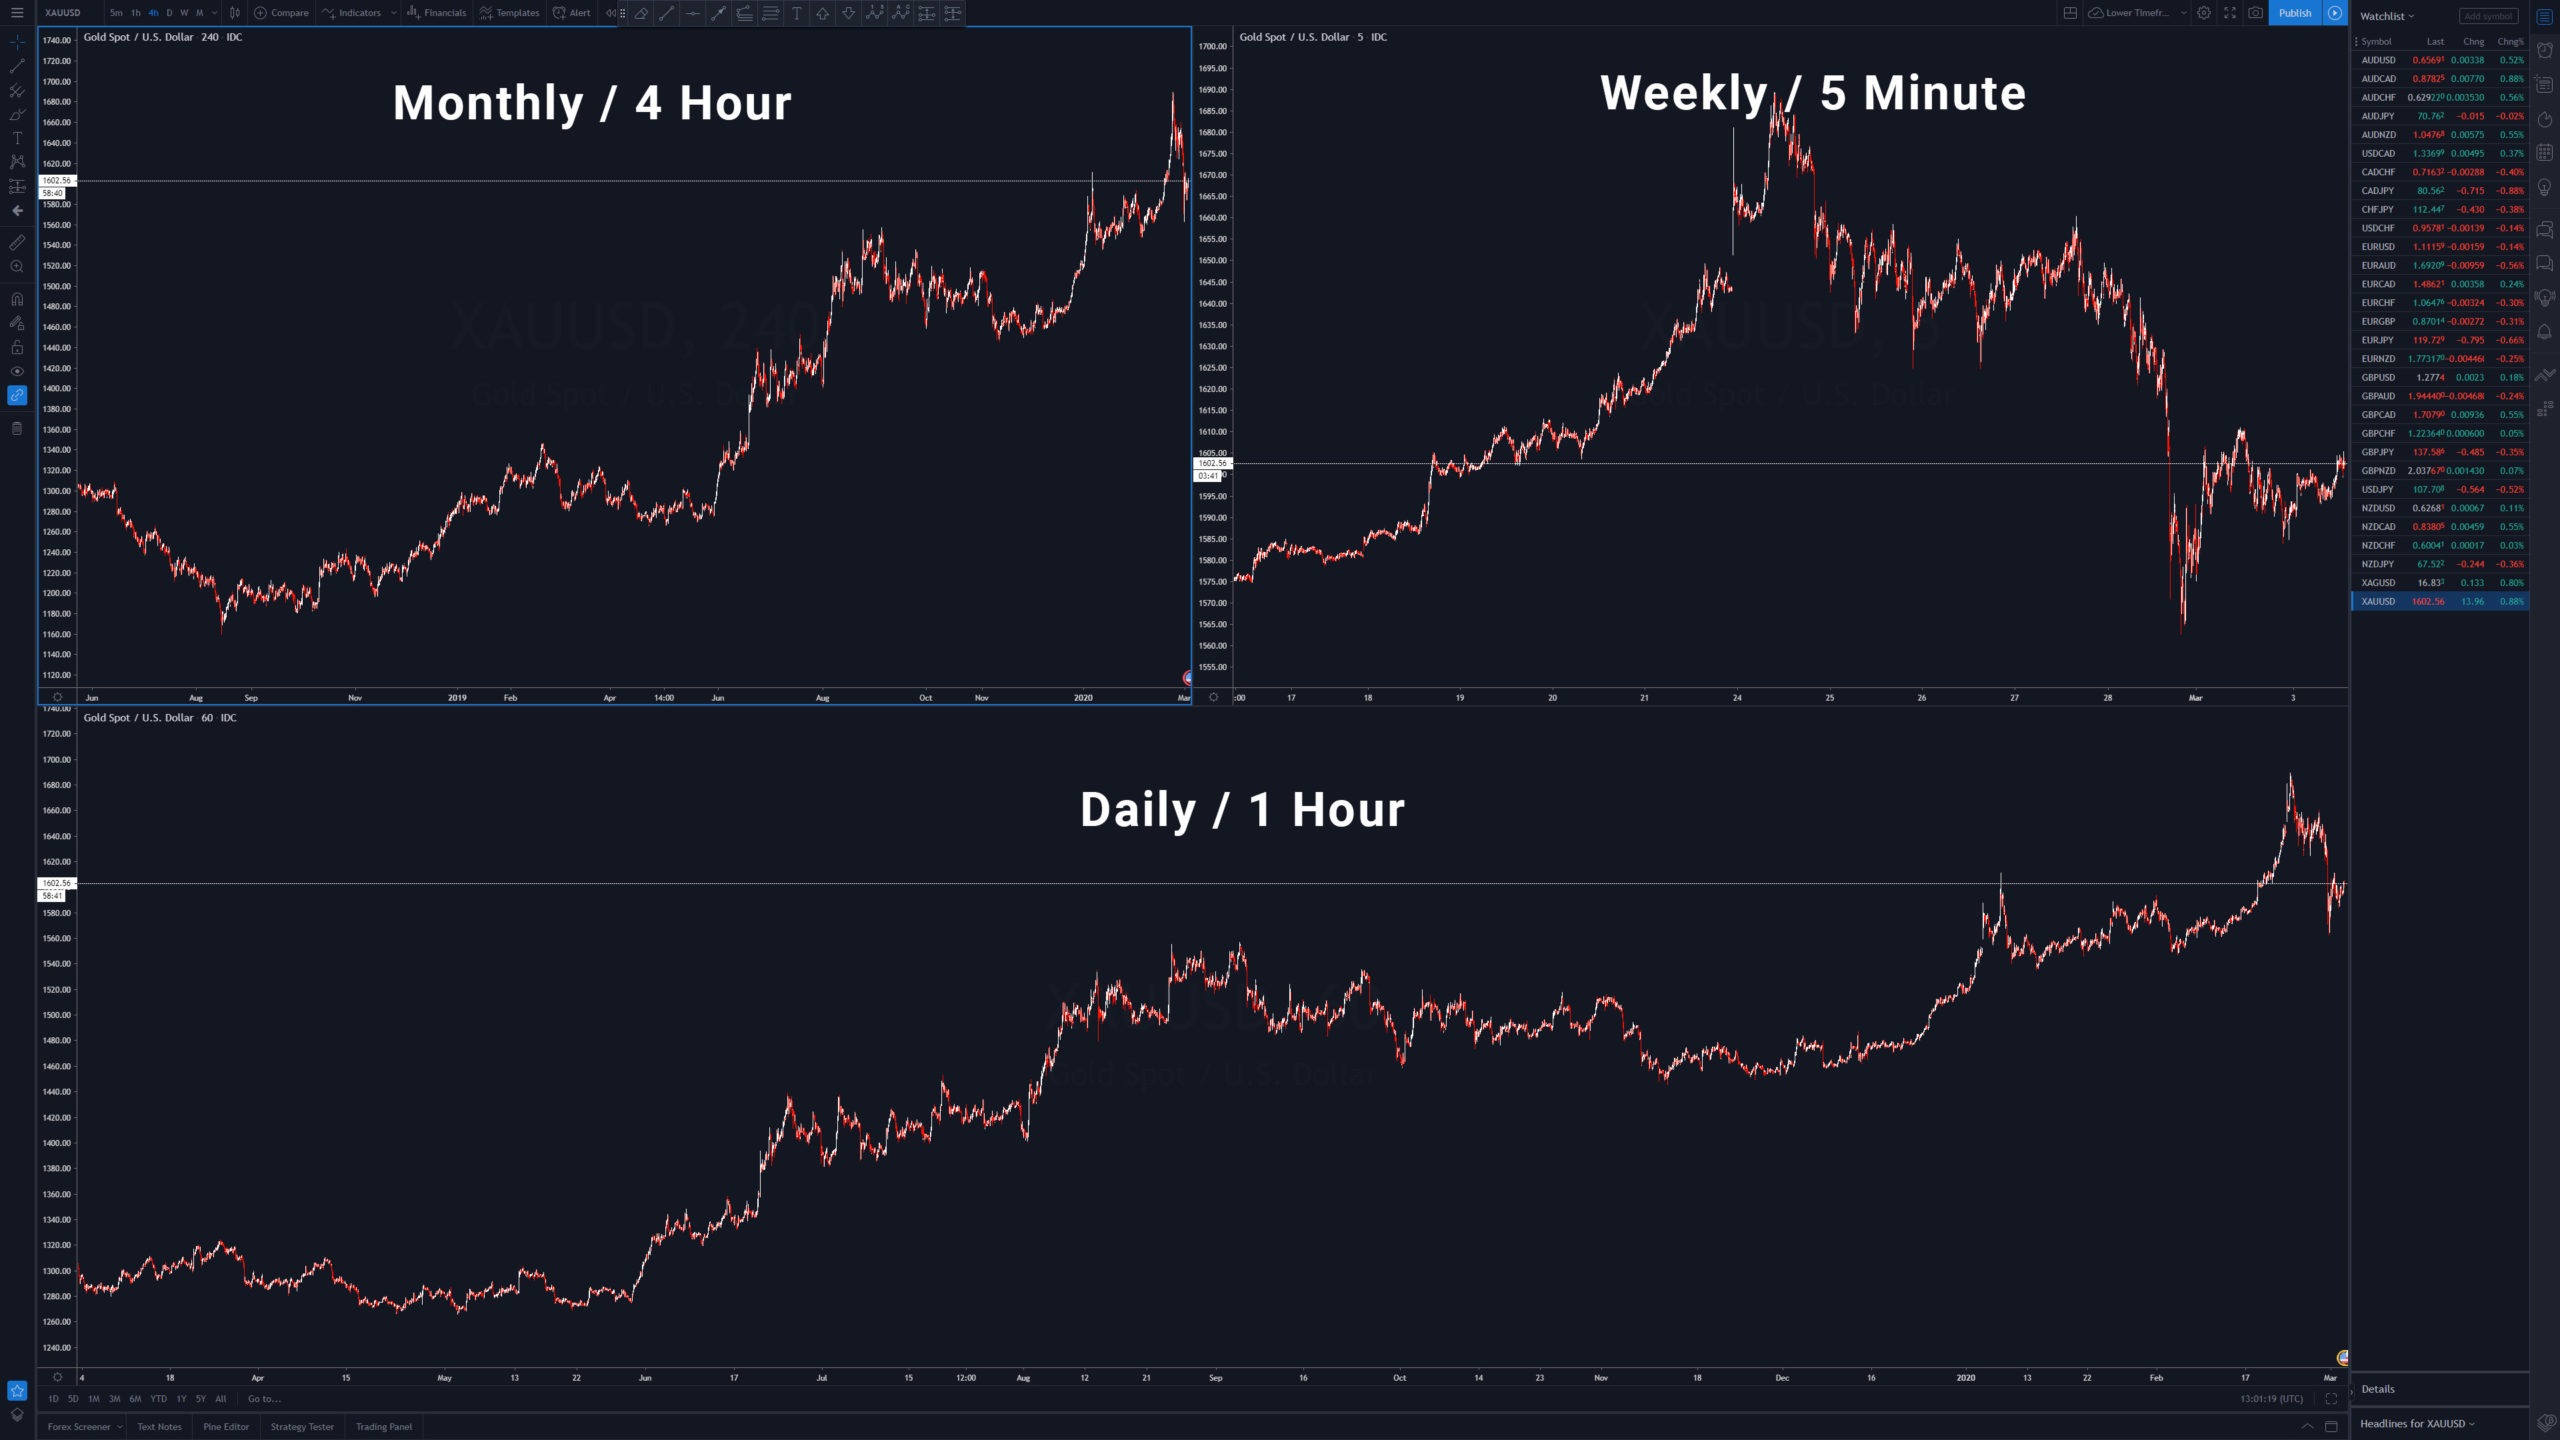
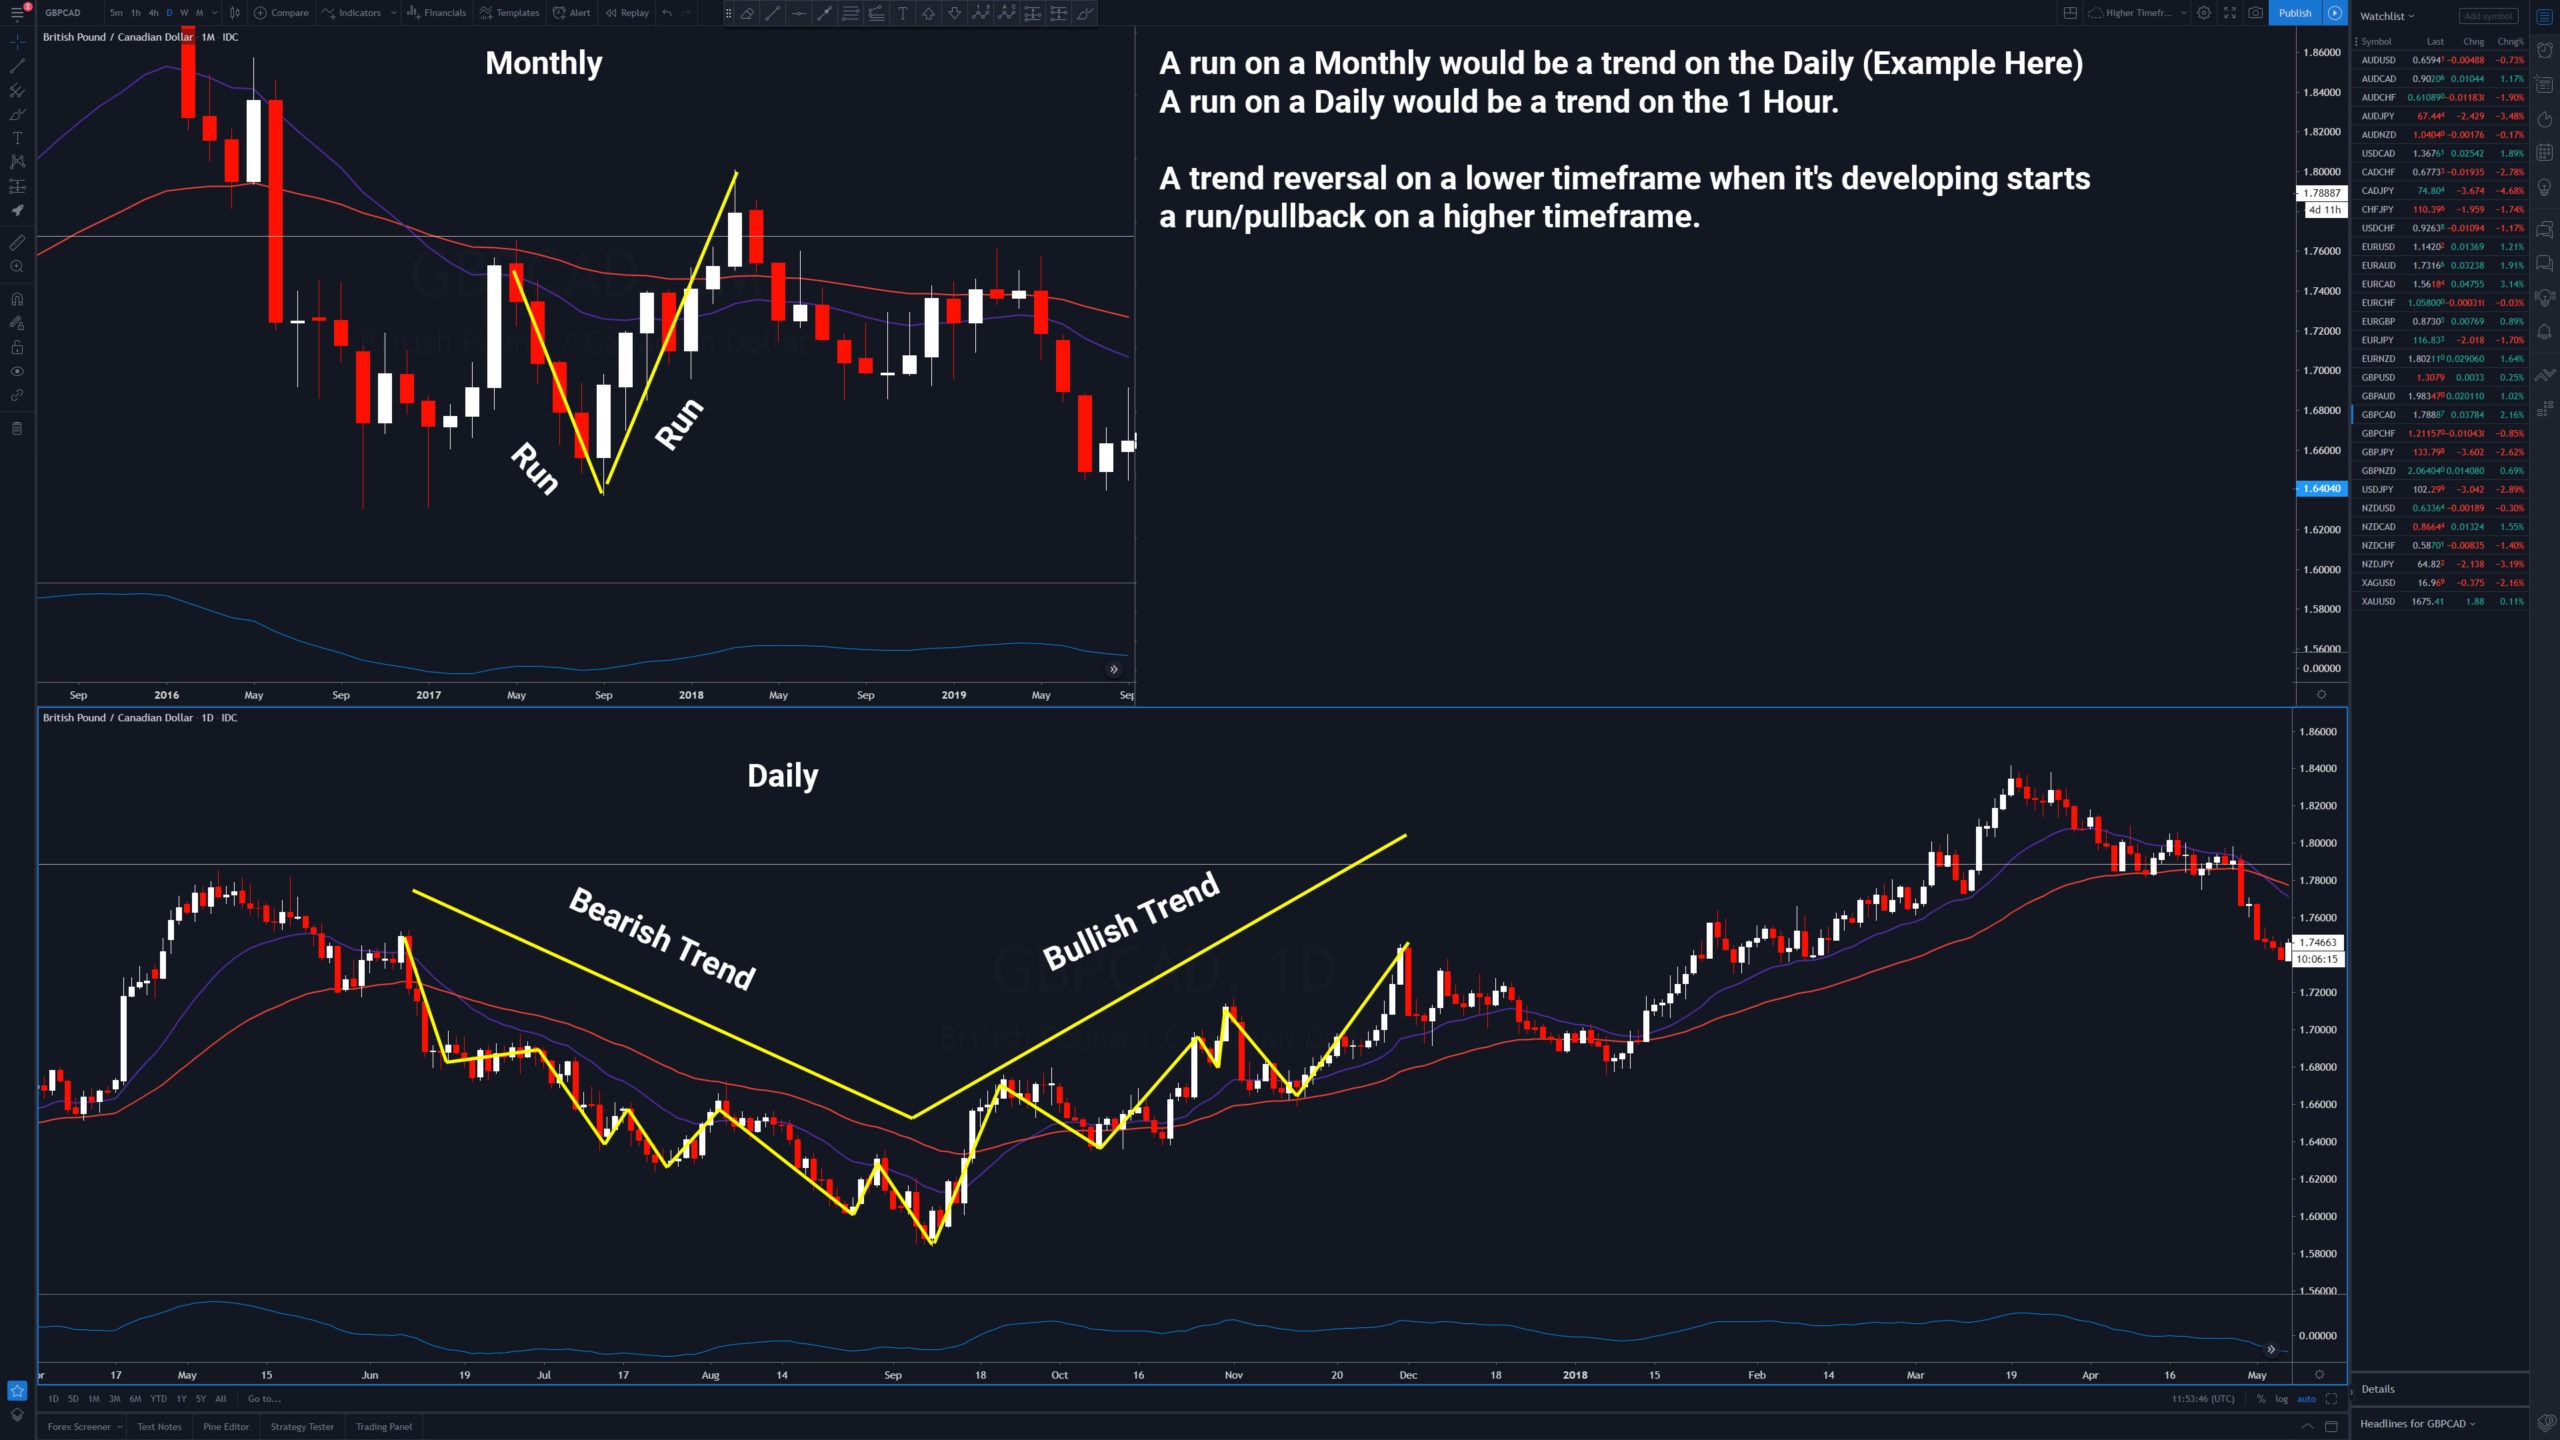
6. Multi-Timeframe Analysis
A run on a higher timeframe is a trend on a lower timeframe
A trend on a lower timeframe is a run on a higher timeframe
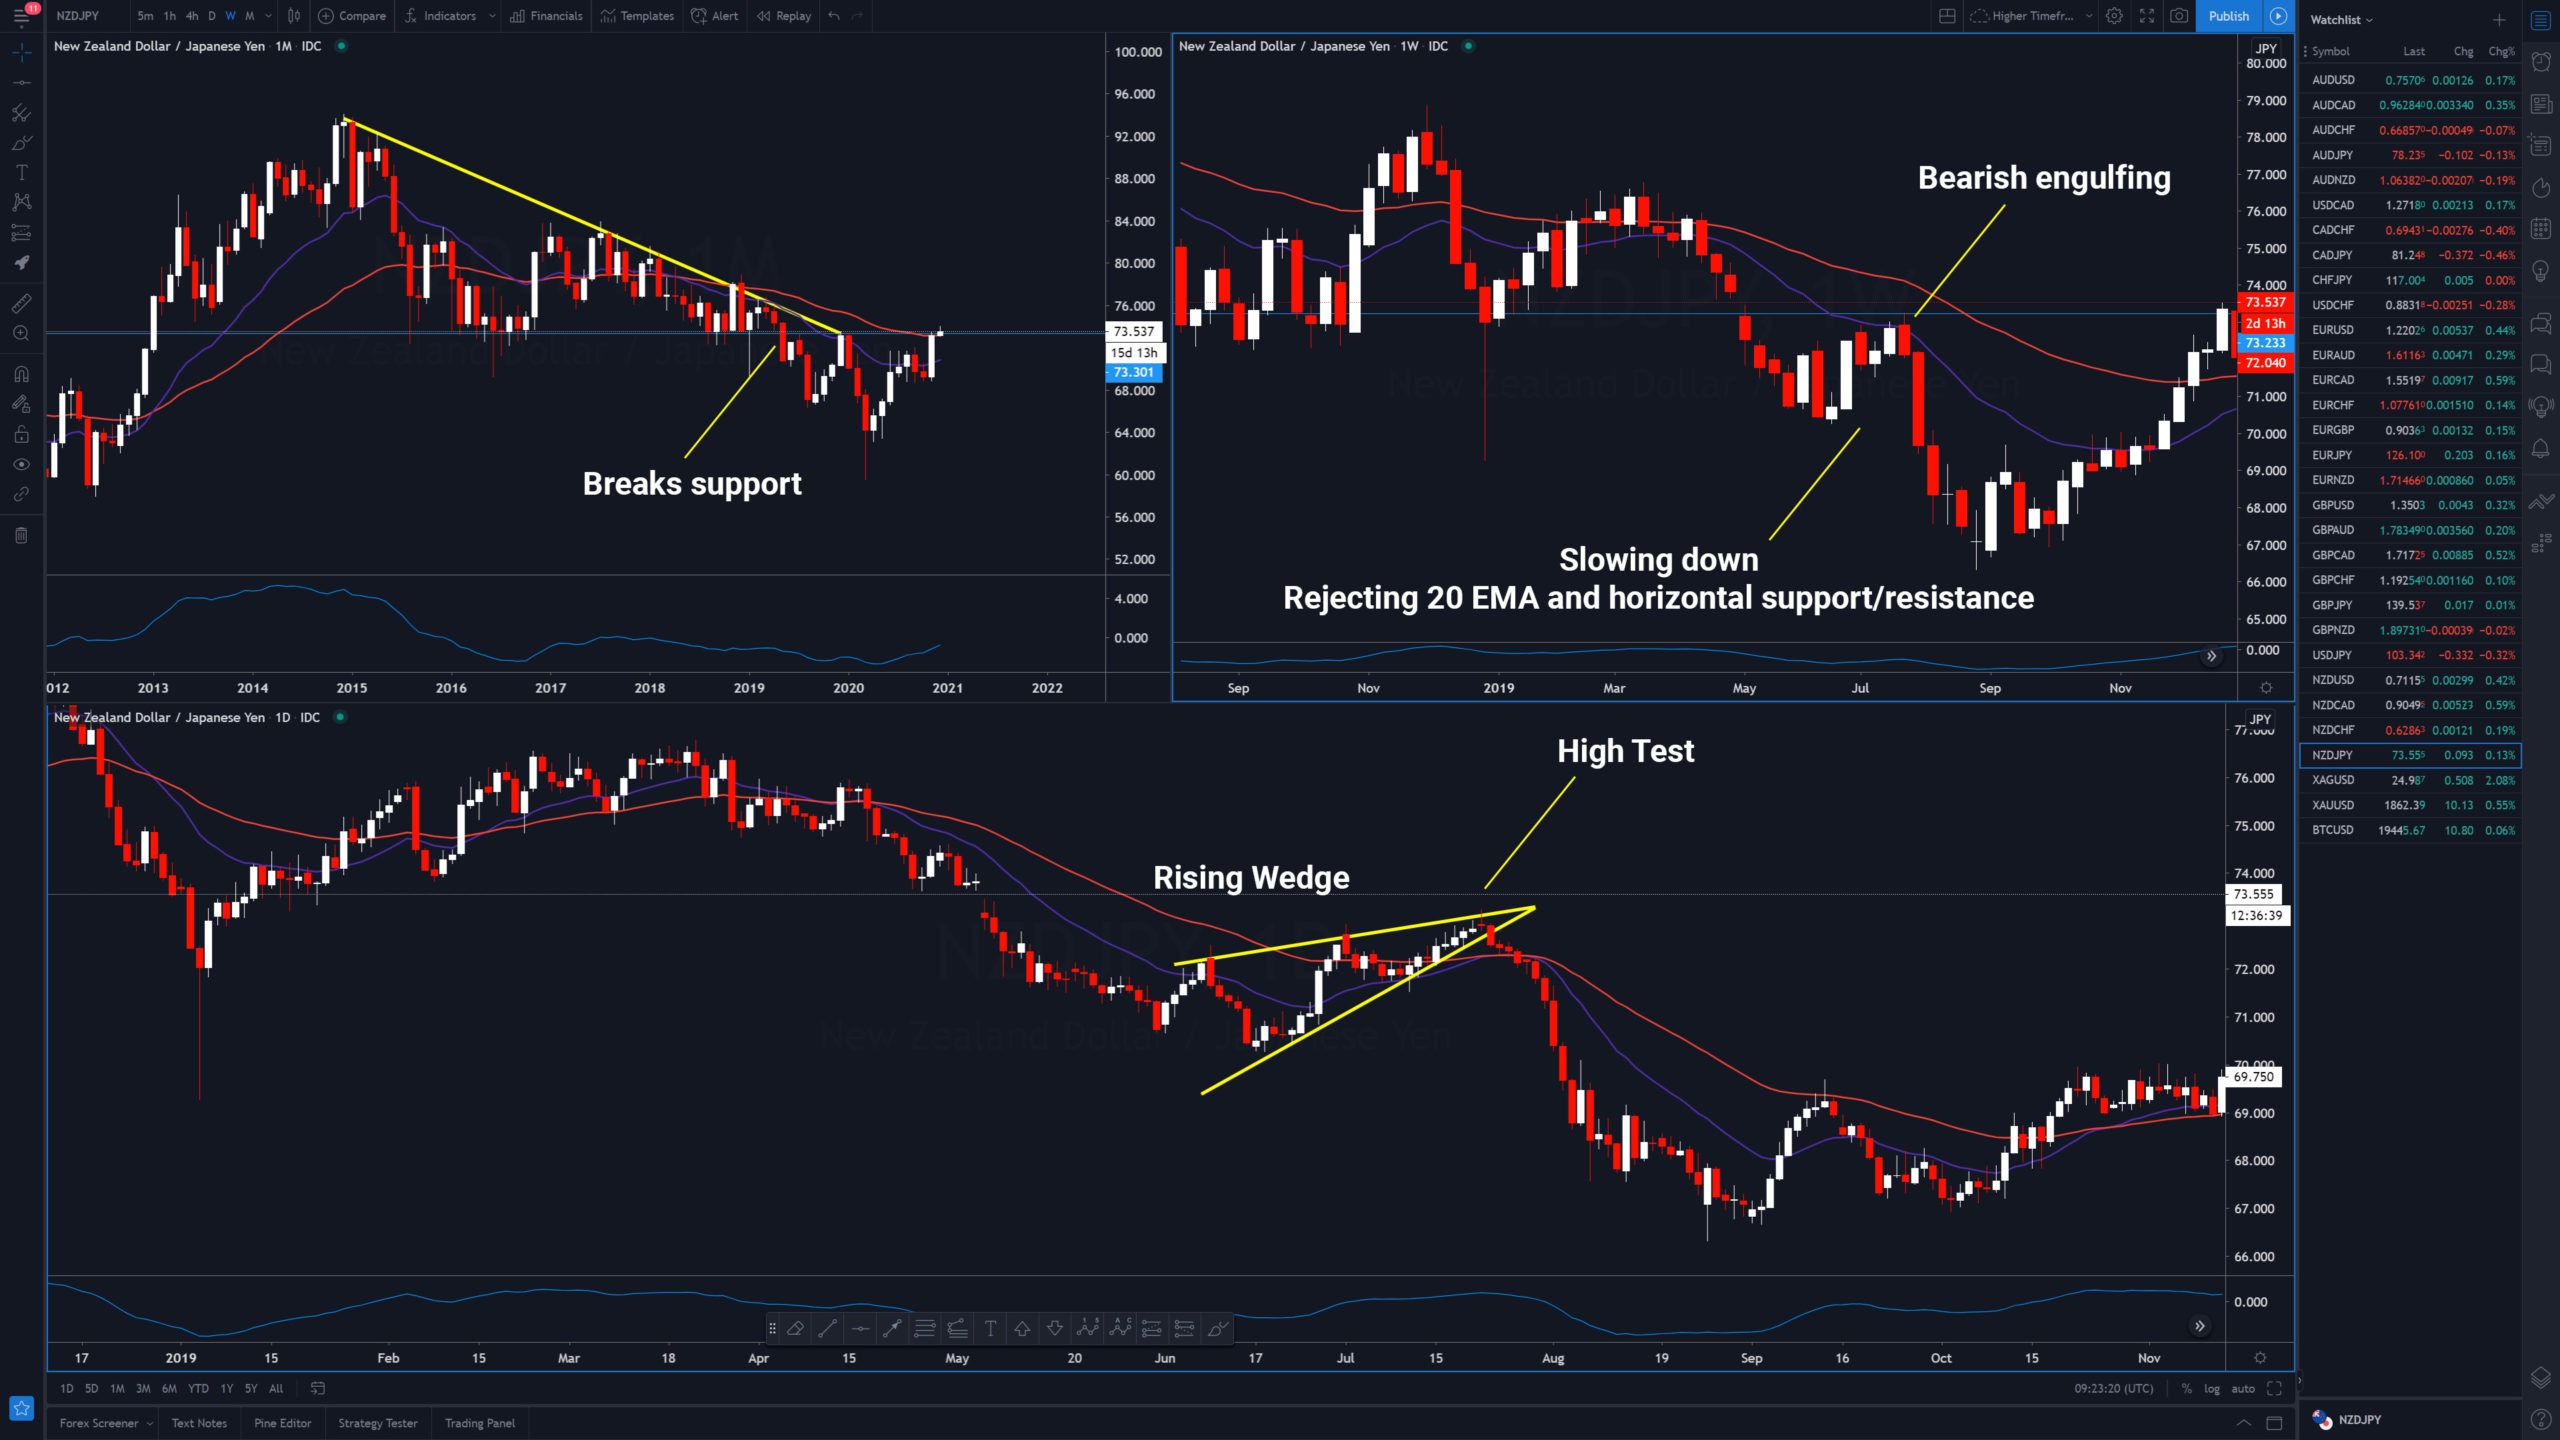
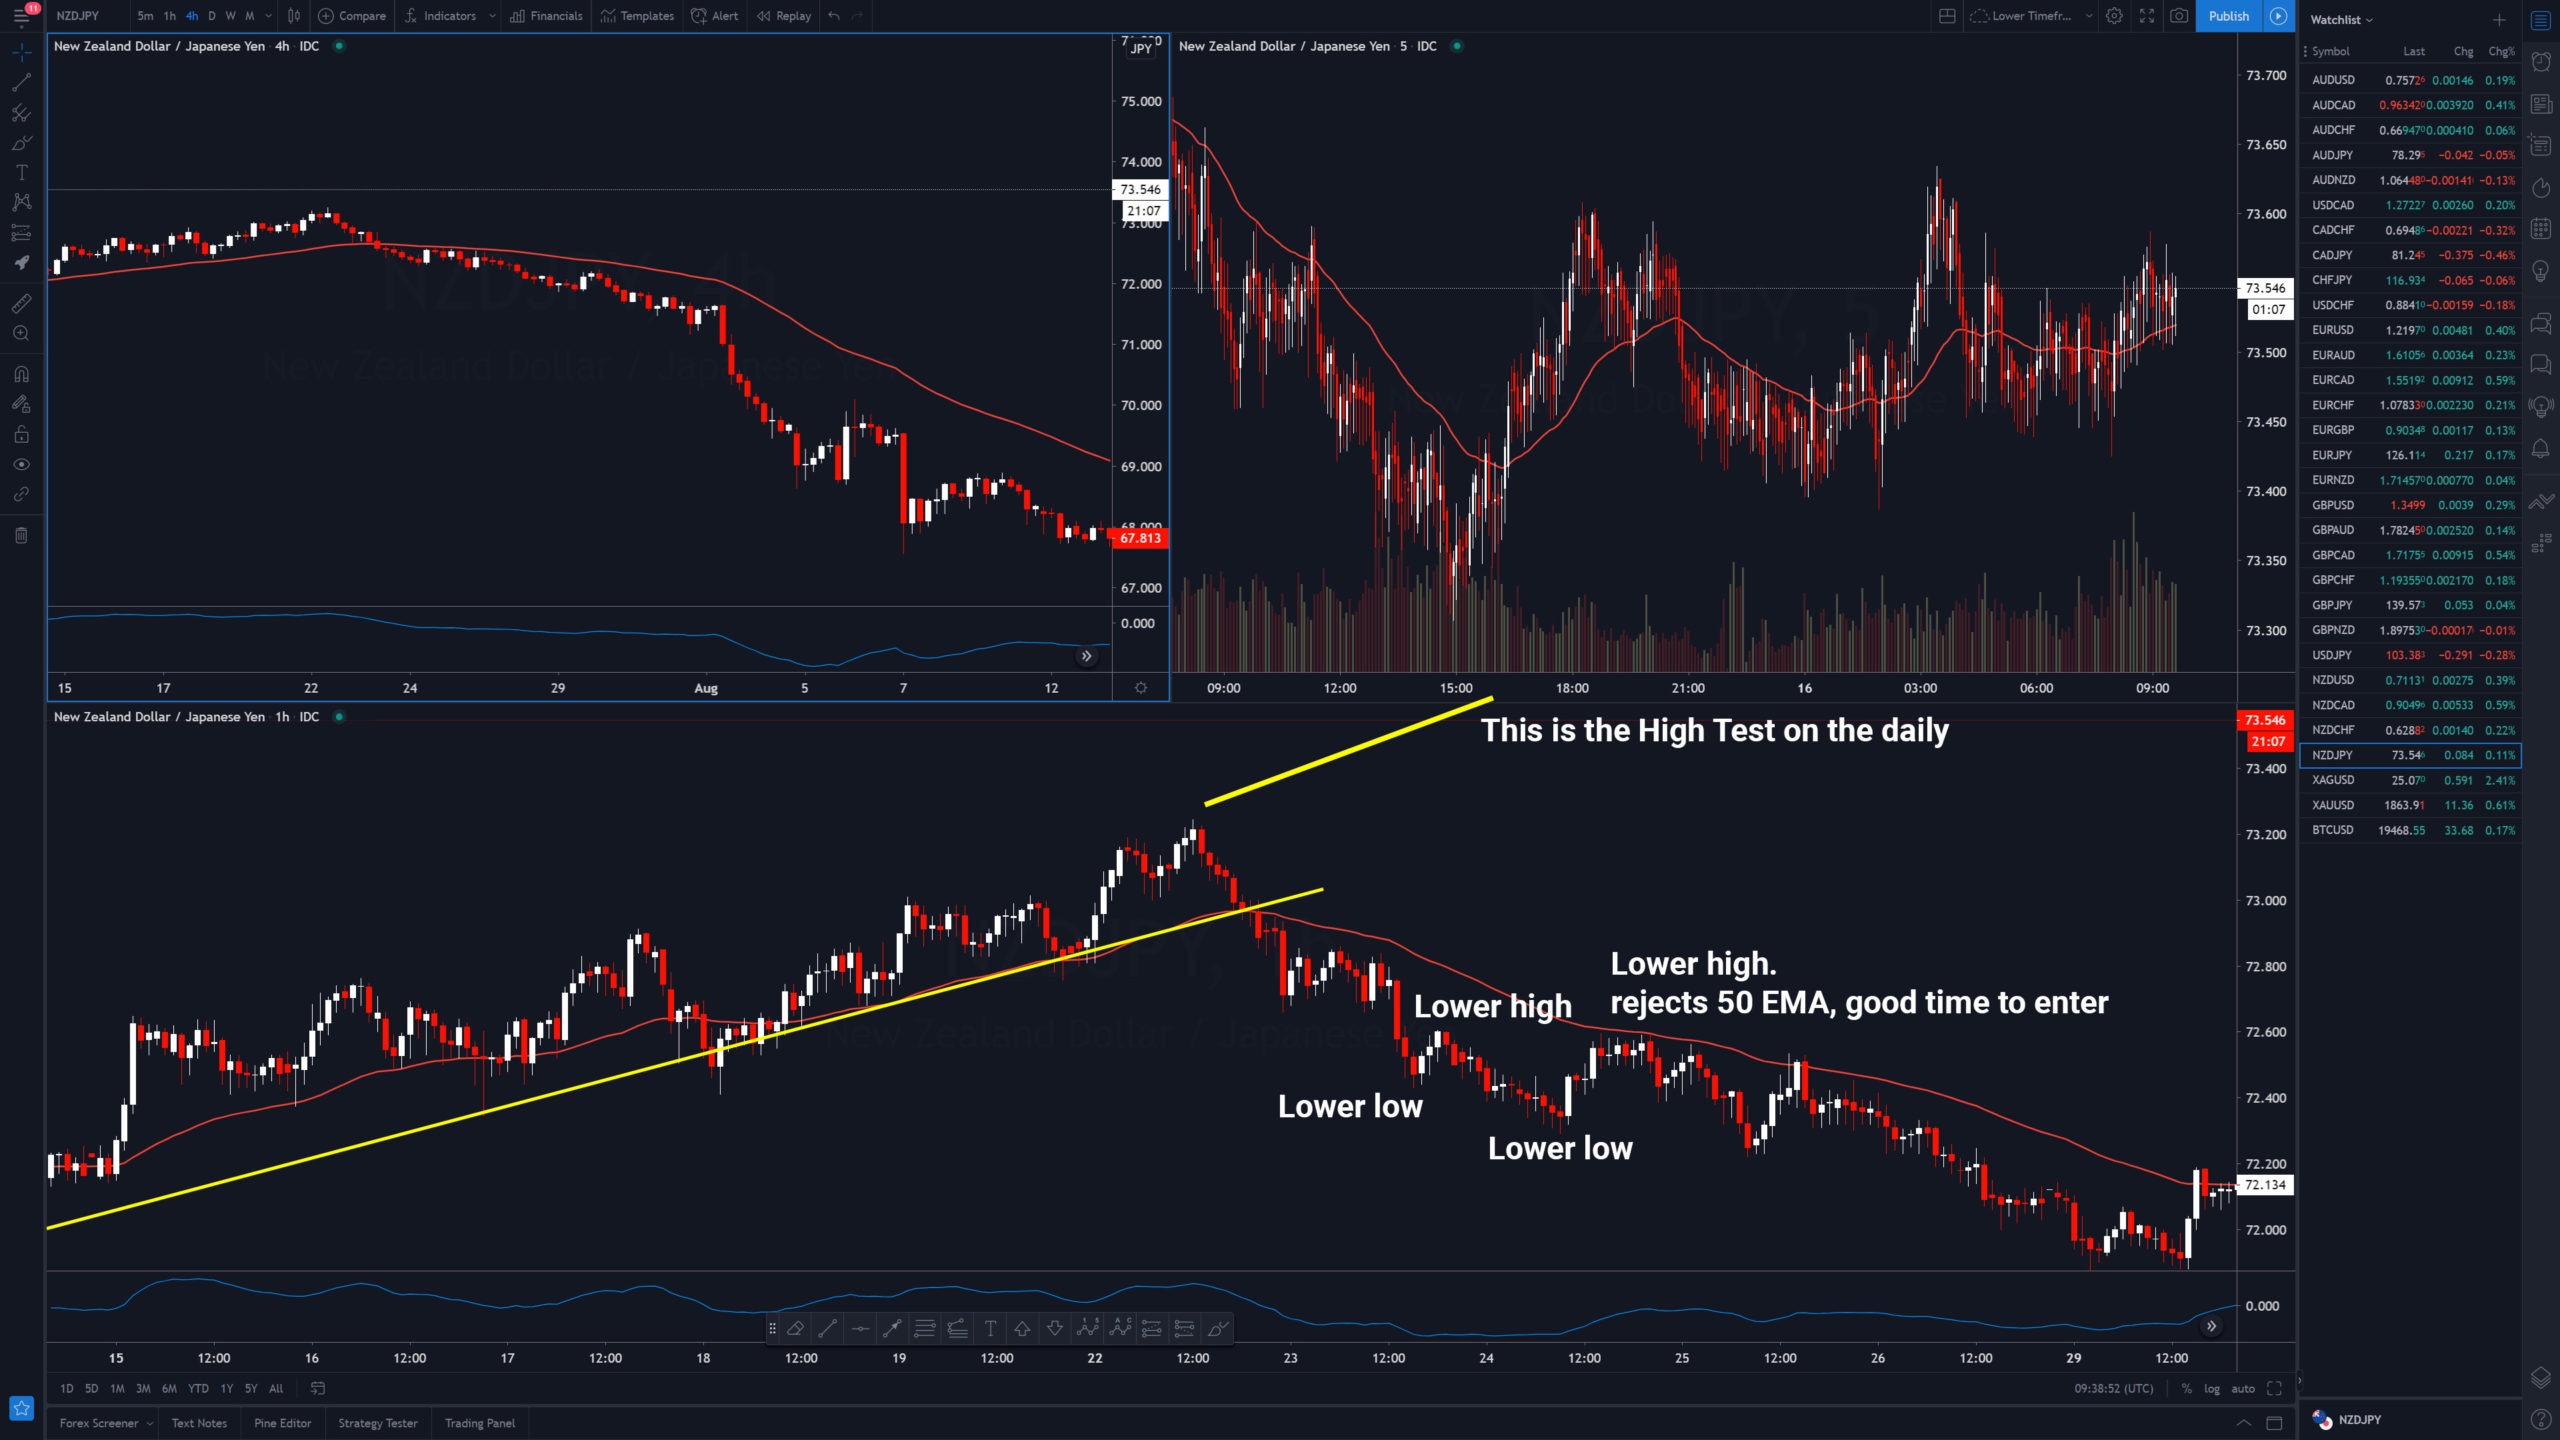
Deceleration On MTF
Deceleration is simple. When something is slowing down at support look for some kind of bullish price action. Patterns, Candle Sticks, Full Trend Change.
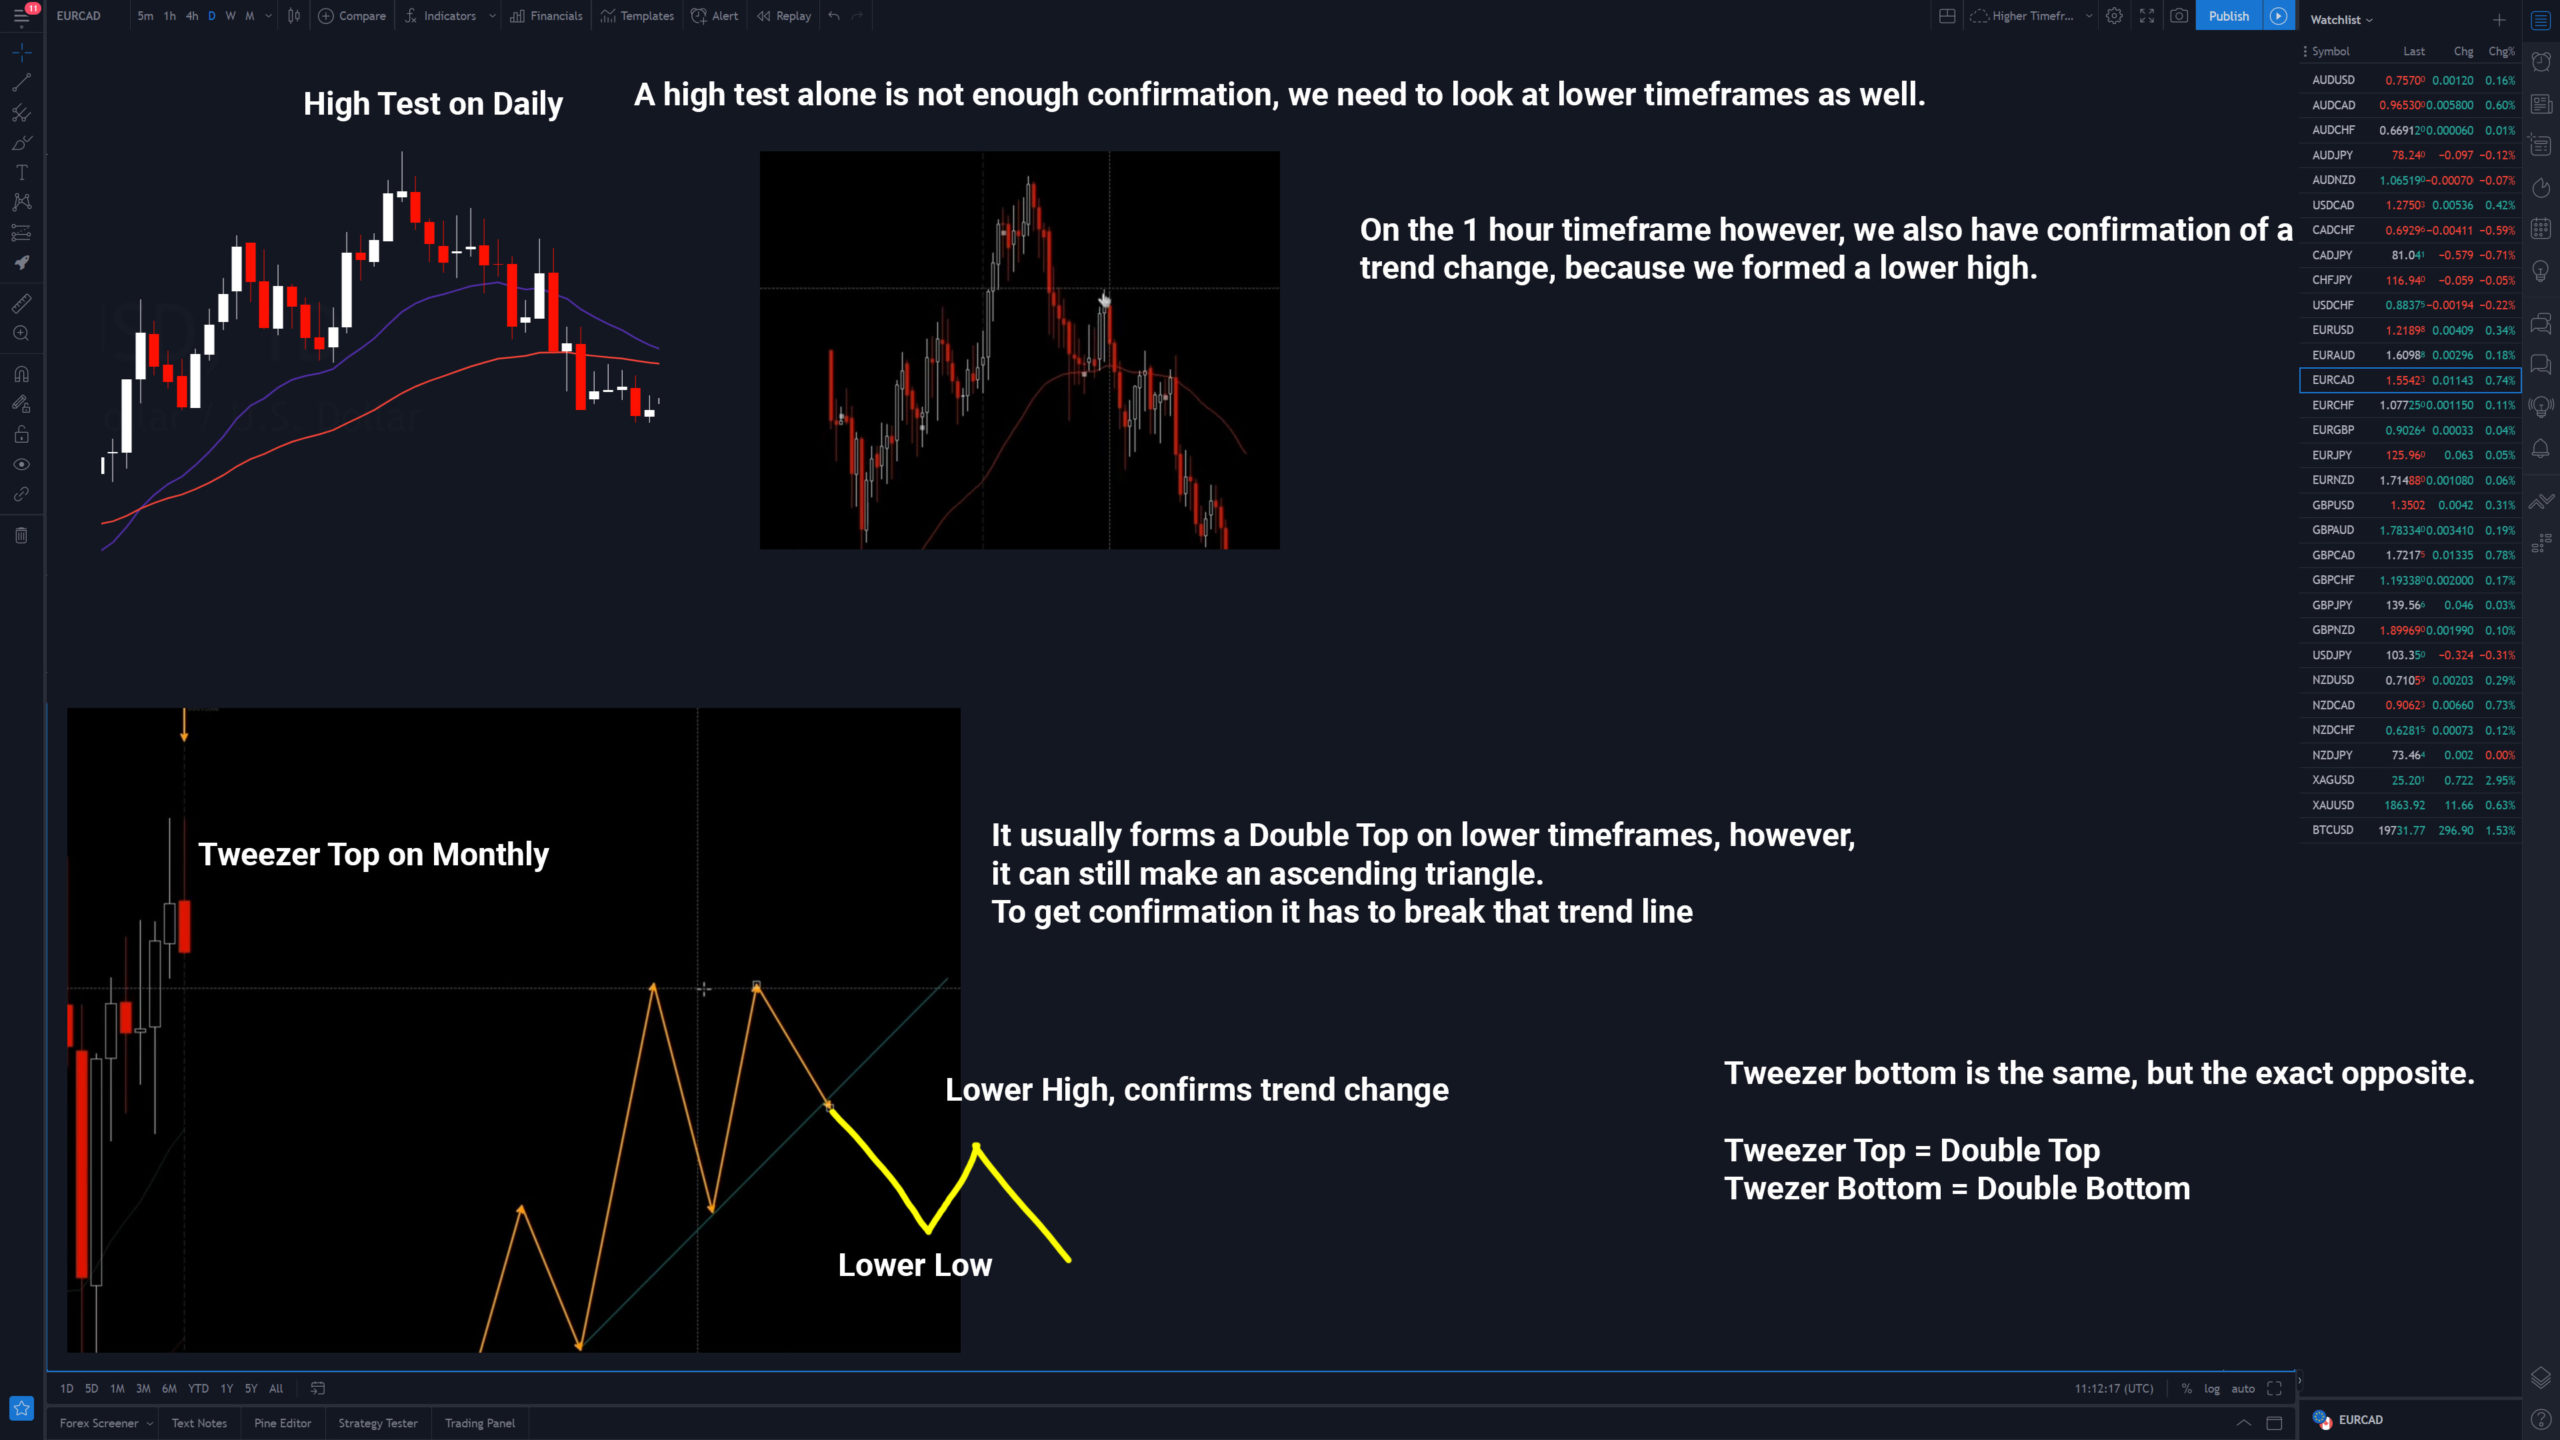
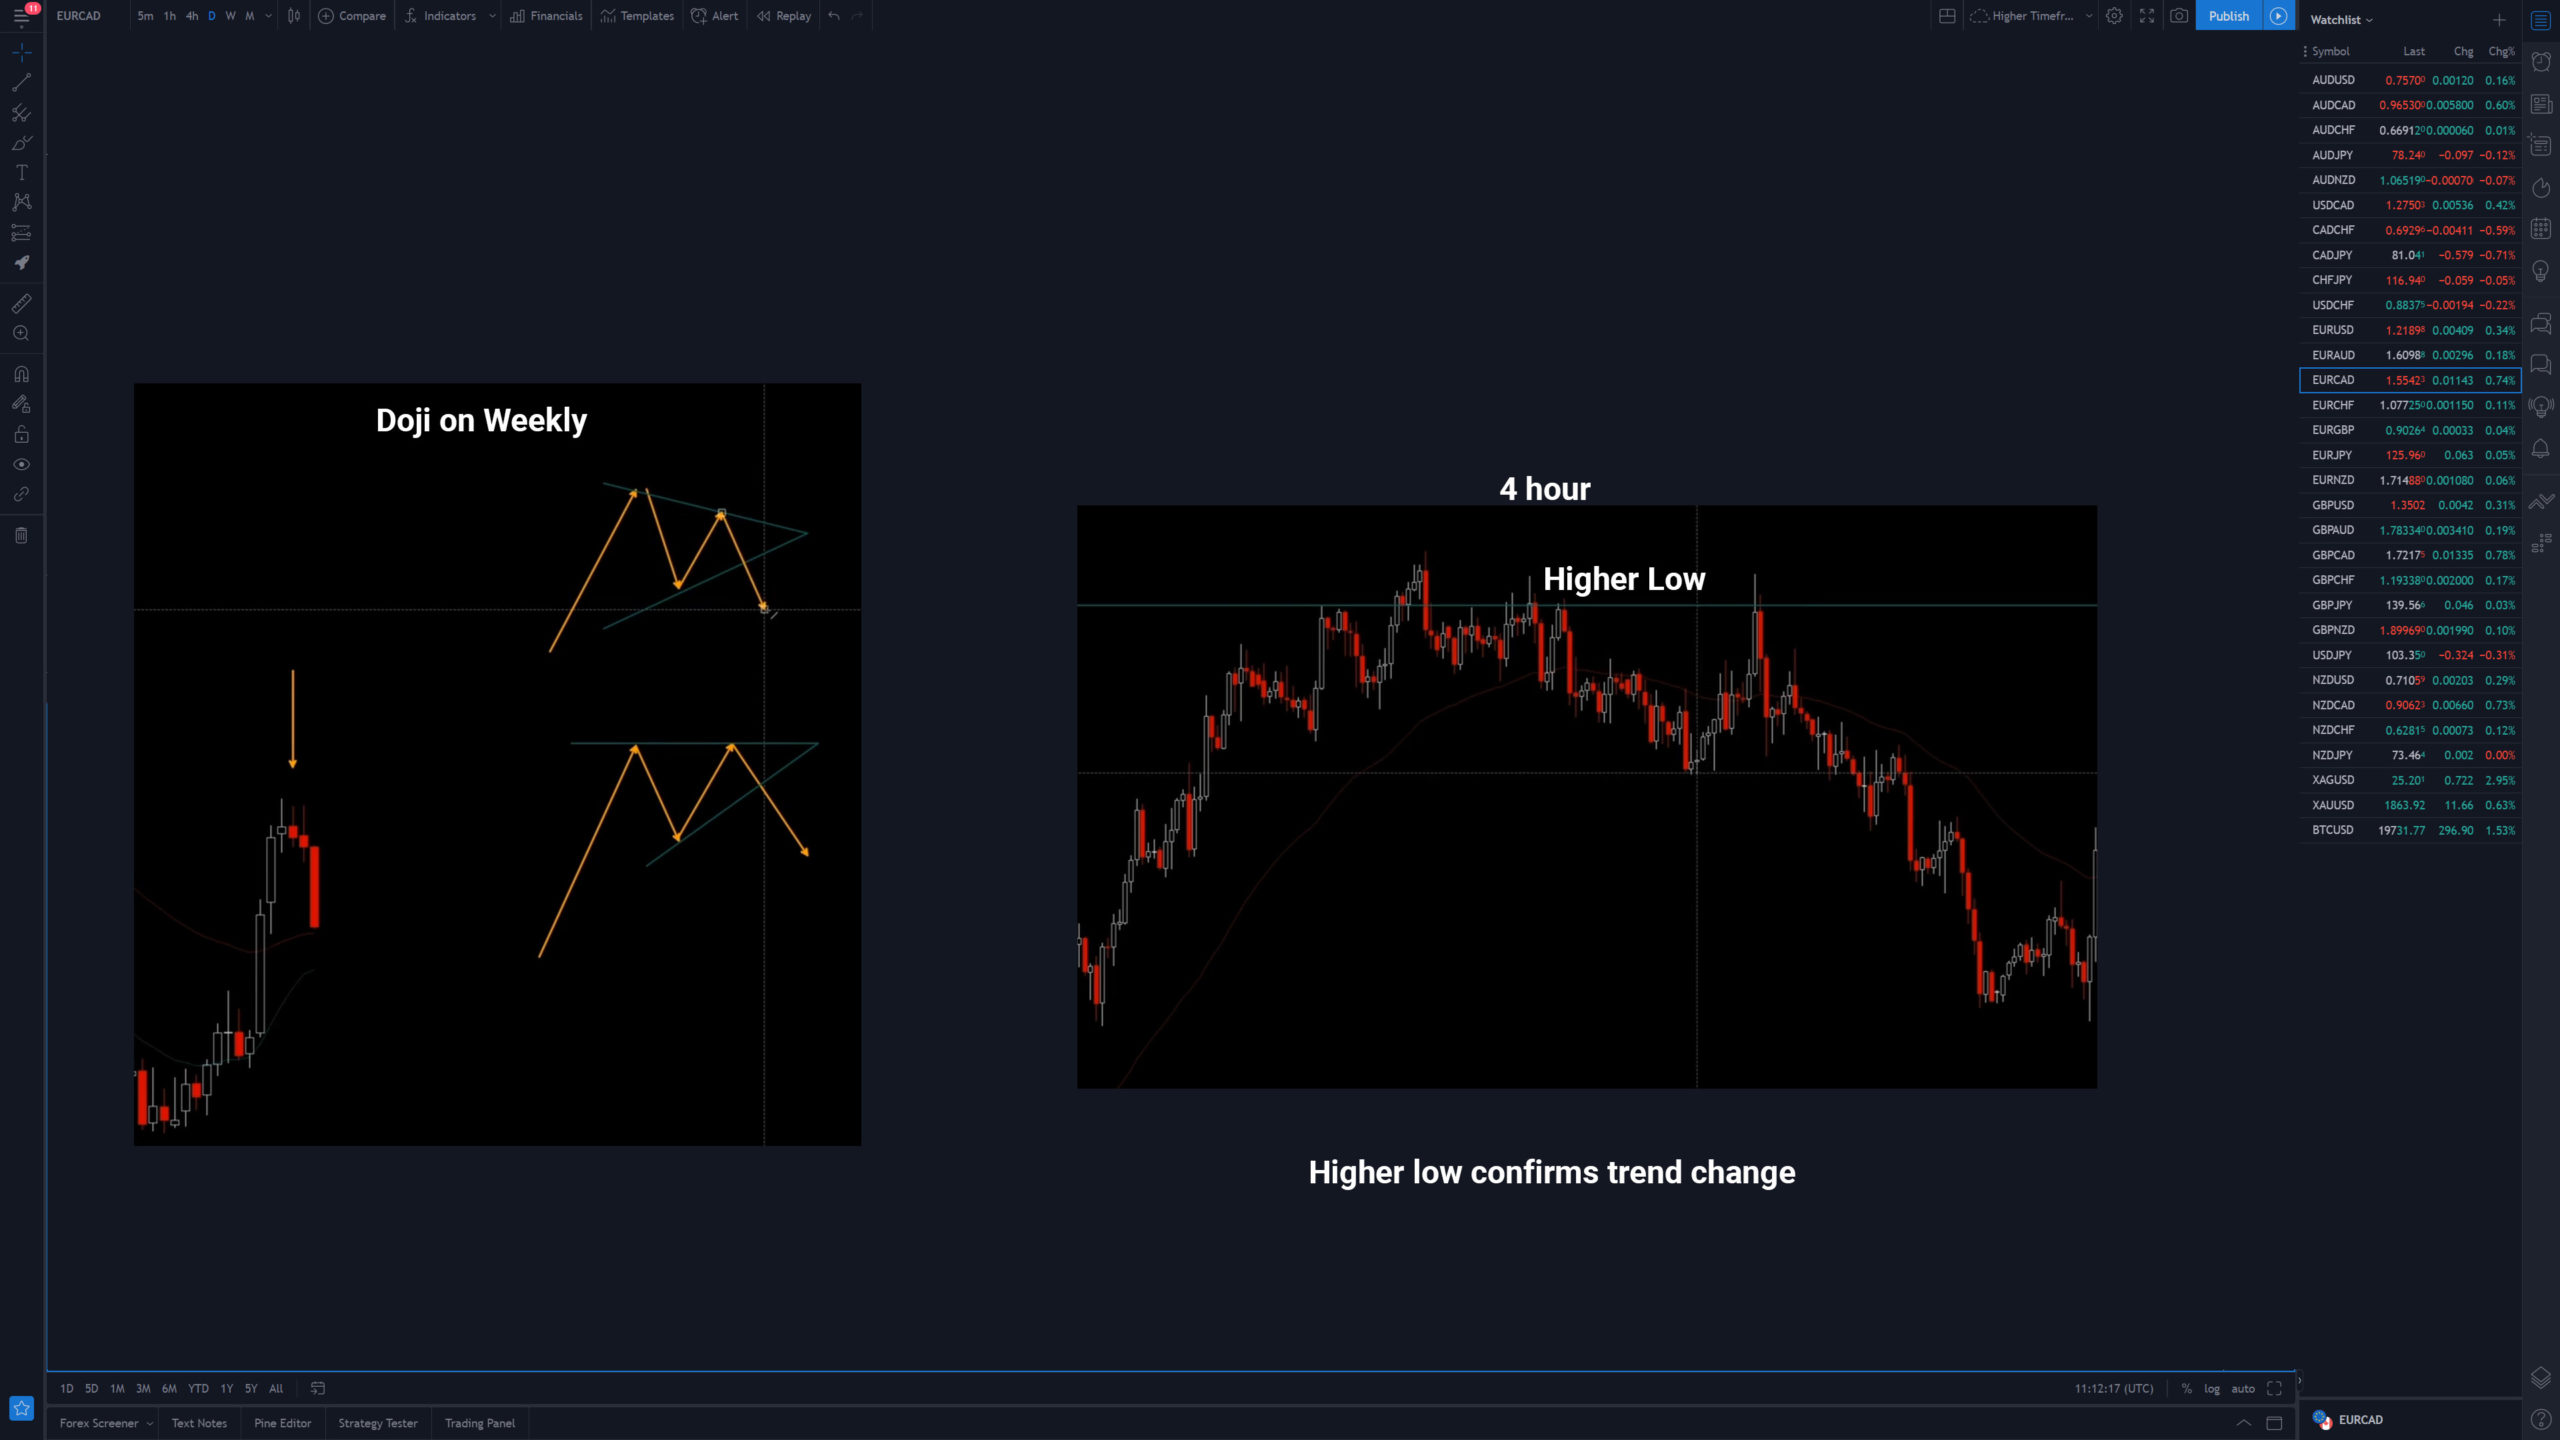
When we are decelerating on a higher timeframe we should have a little bit more (confirmation) on a lower timeframe.
Higher Timeframe:
Lower Timeframe:
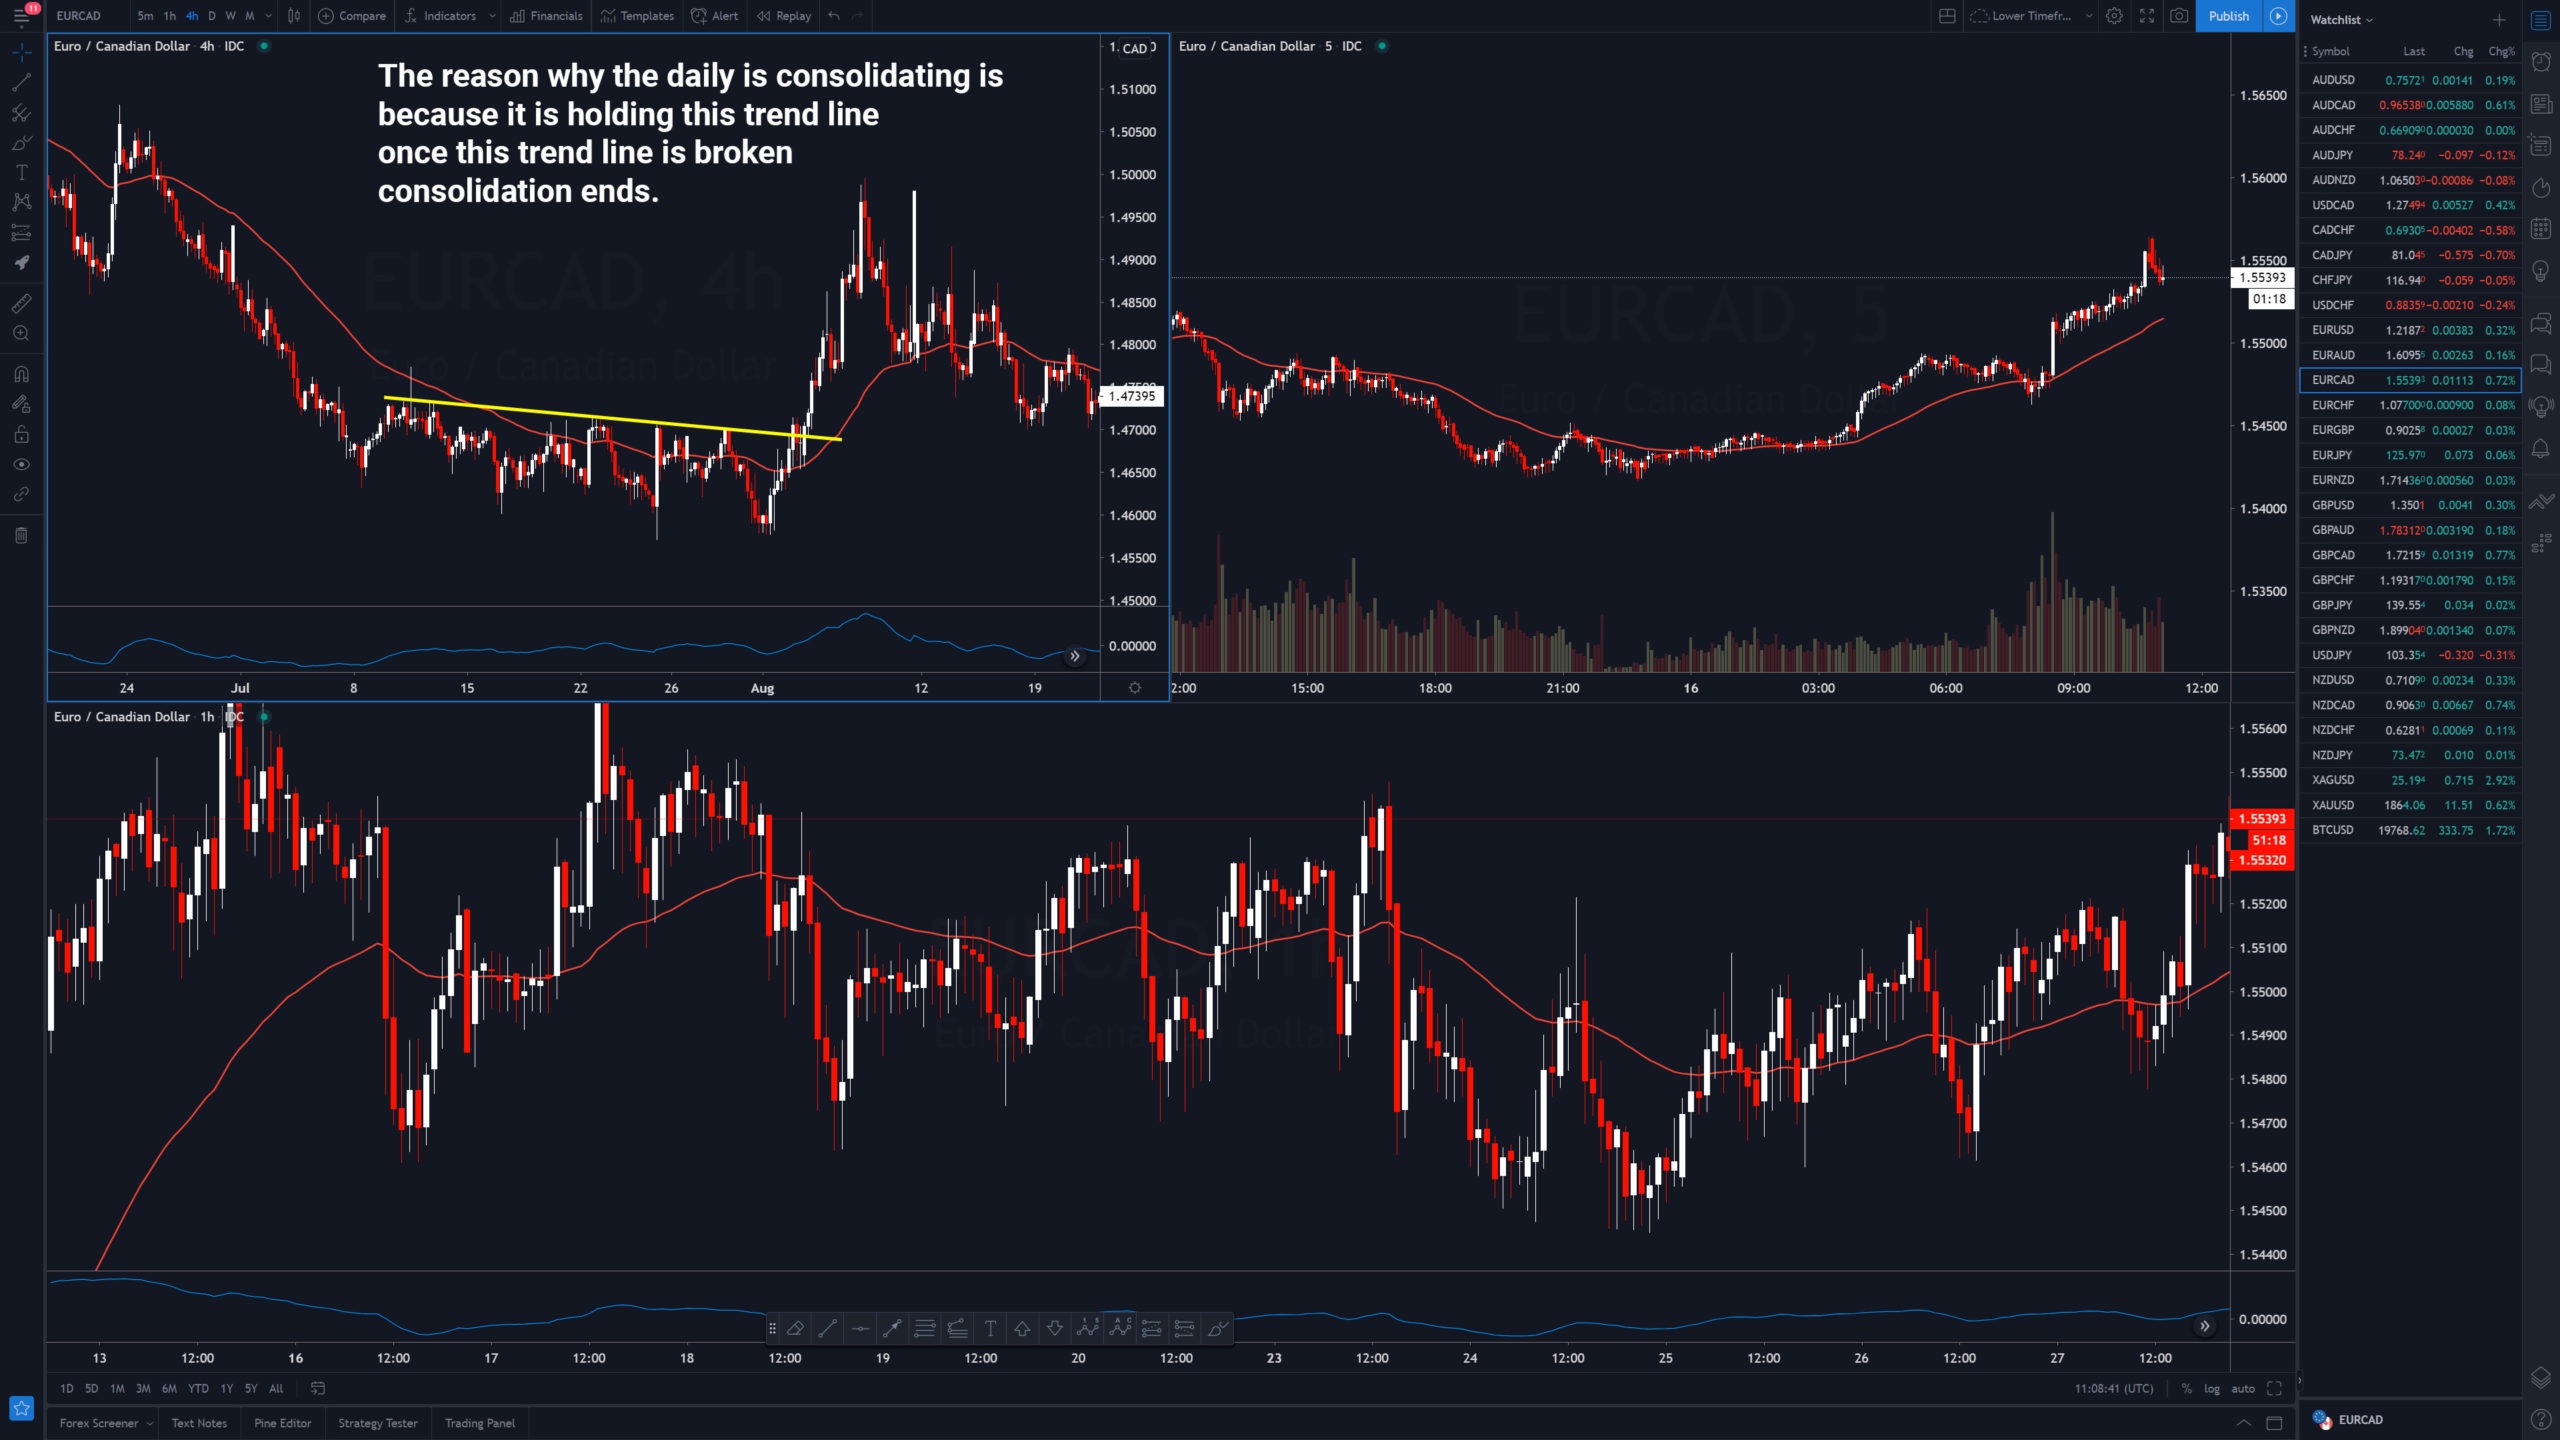
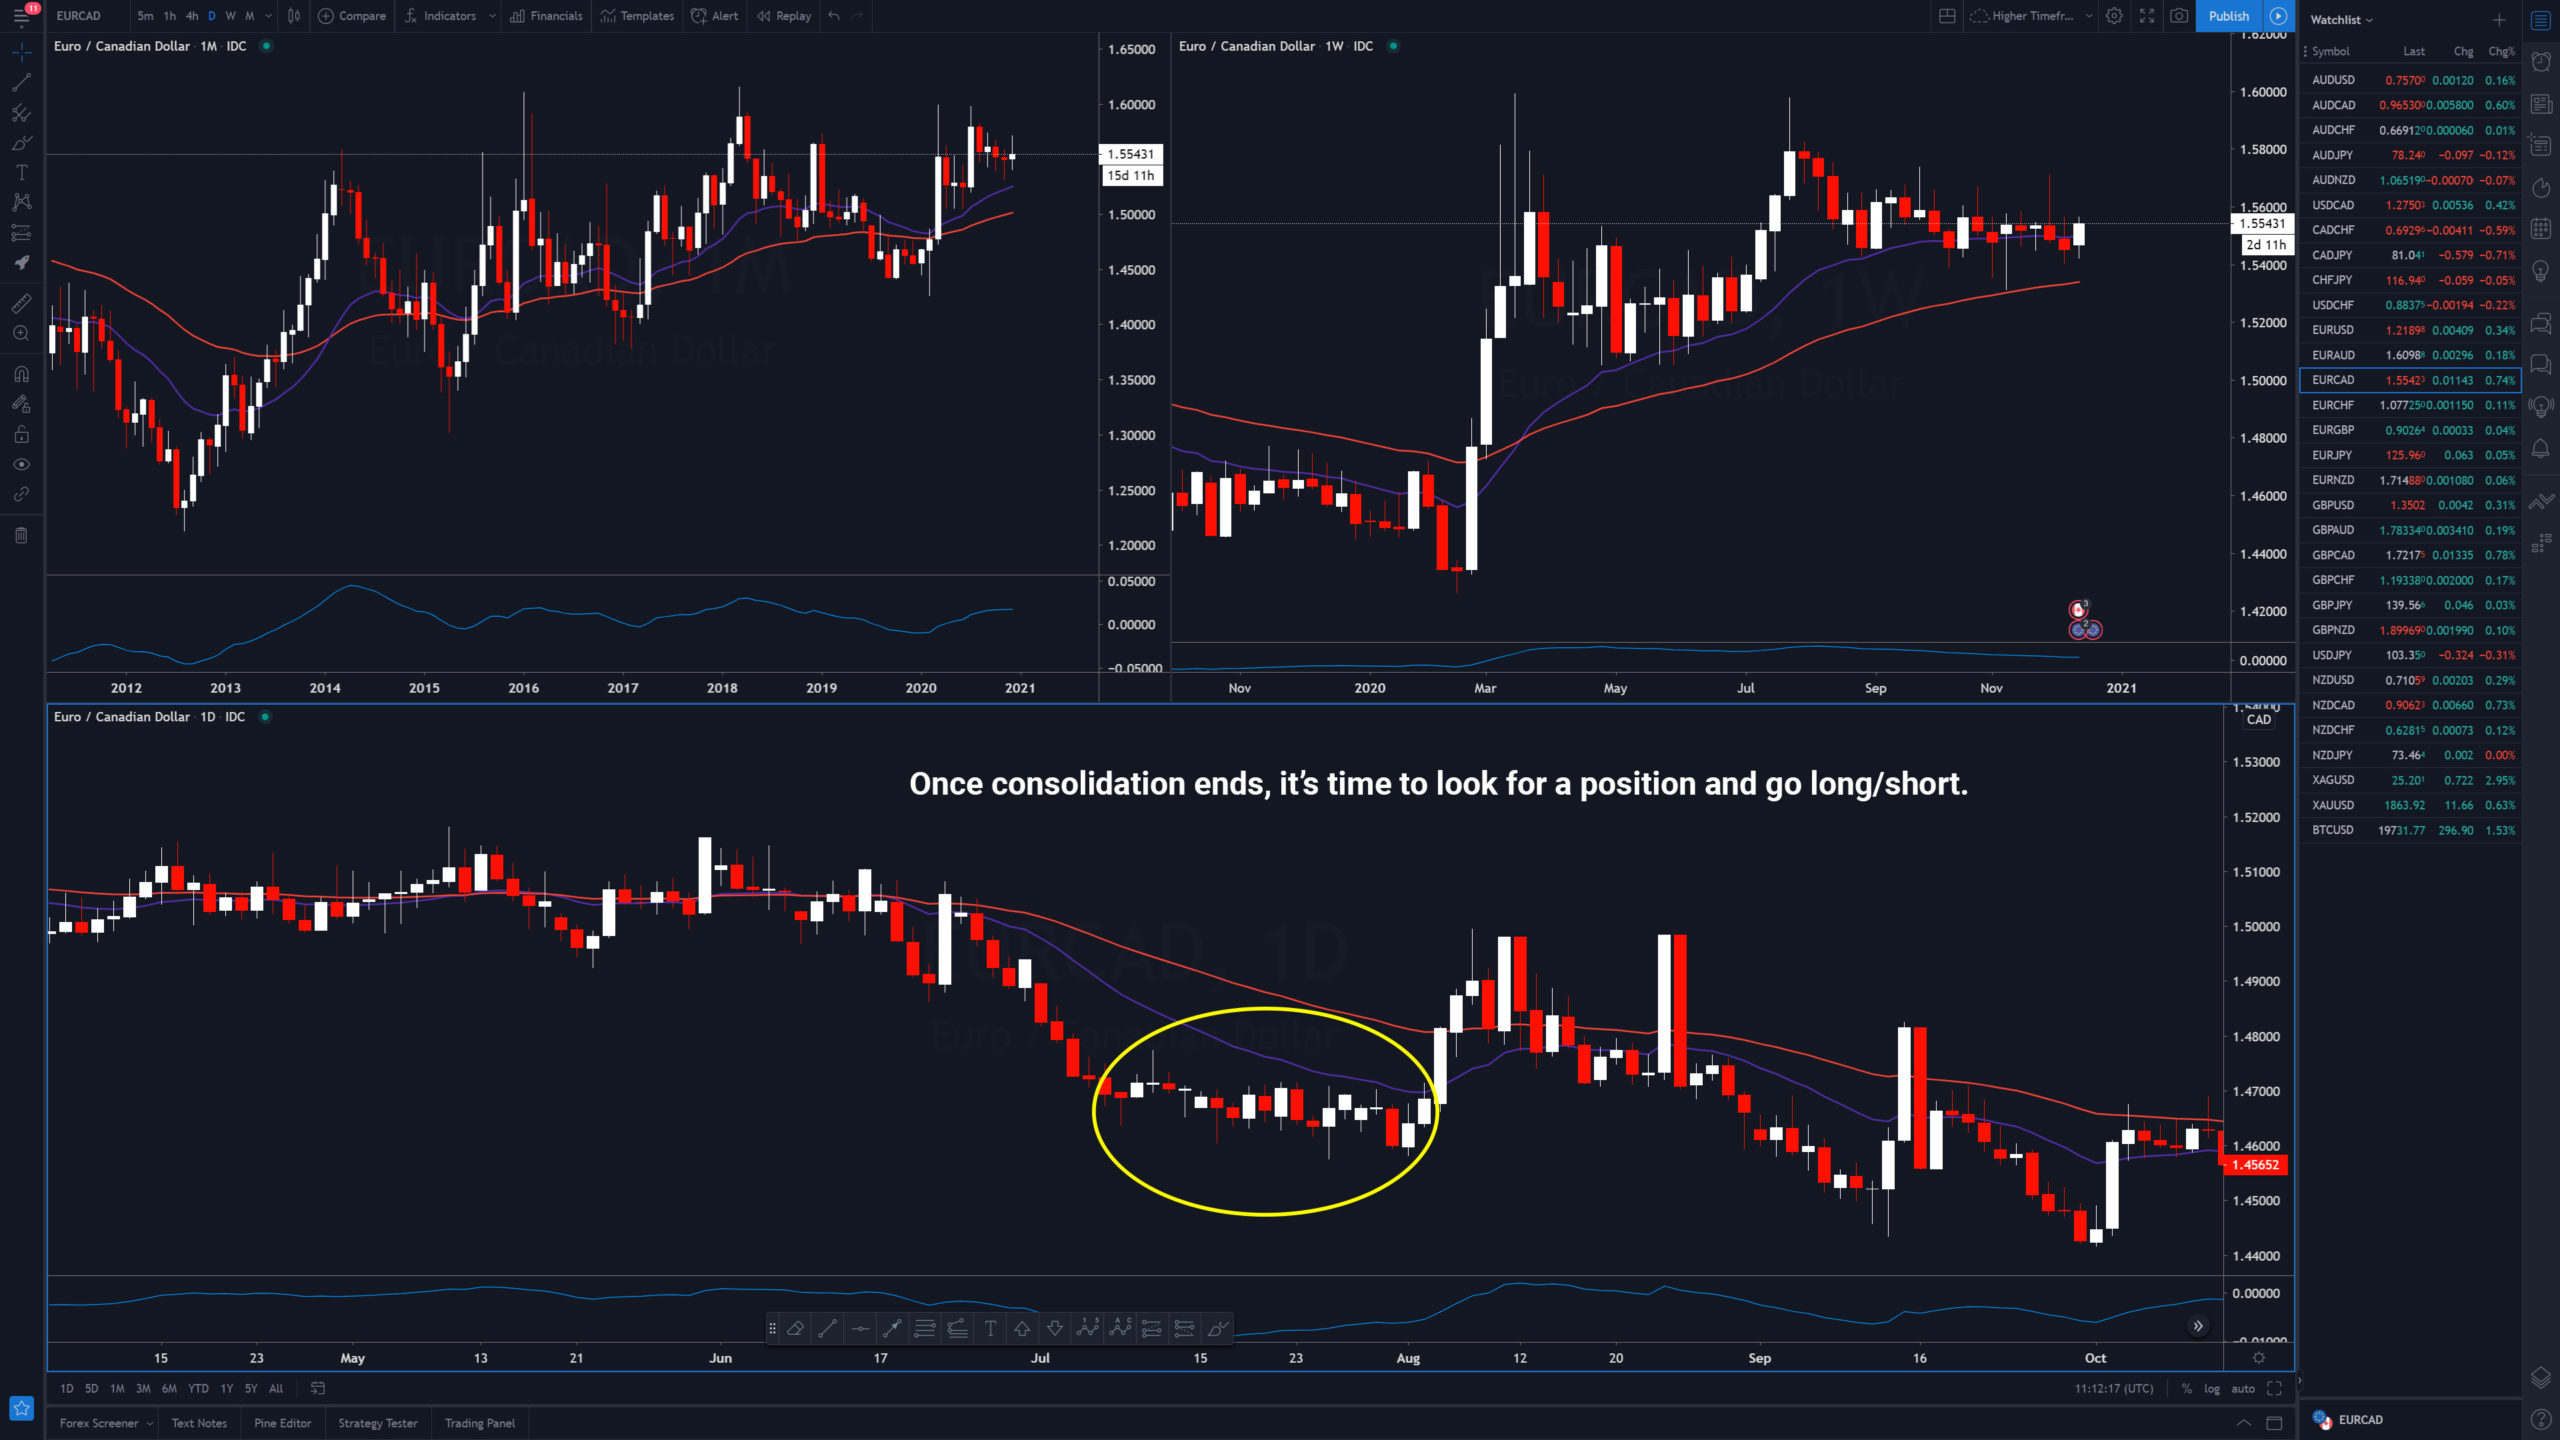
Consolidation On MTF
Why is price consolidating? Why are we not breaking out or down, why just sideways? Simply looking at 1 timeframe, is not going to tell us. That's why we look at other timeframes as well. The only way to know when consolidation on a higher timeframe ends is to look at a lower timeframe and look for it to break consolidation to the upside or downside.
For example. The daily is consolidating, because the 4h is within a price action pattern, once it breaks out of that, consolidation ends.
Candlestick Formations Using MTF Analysis
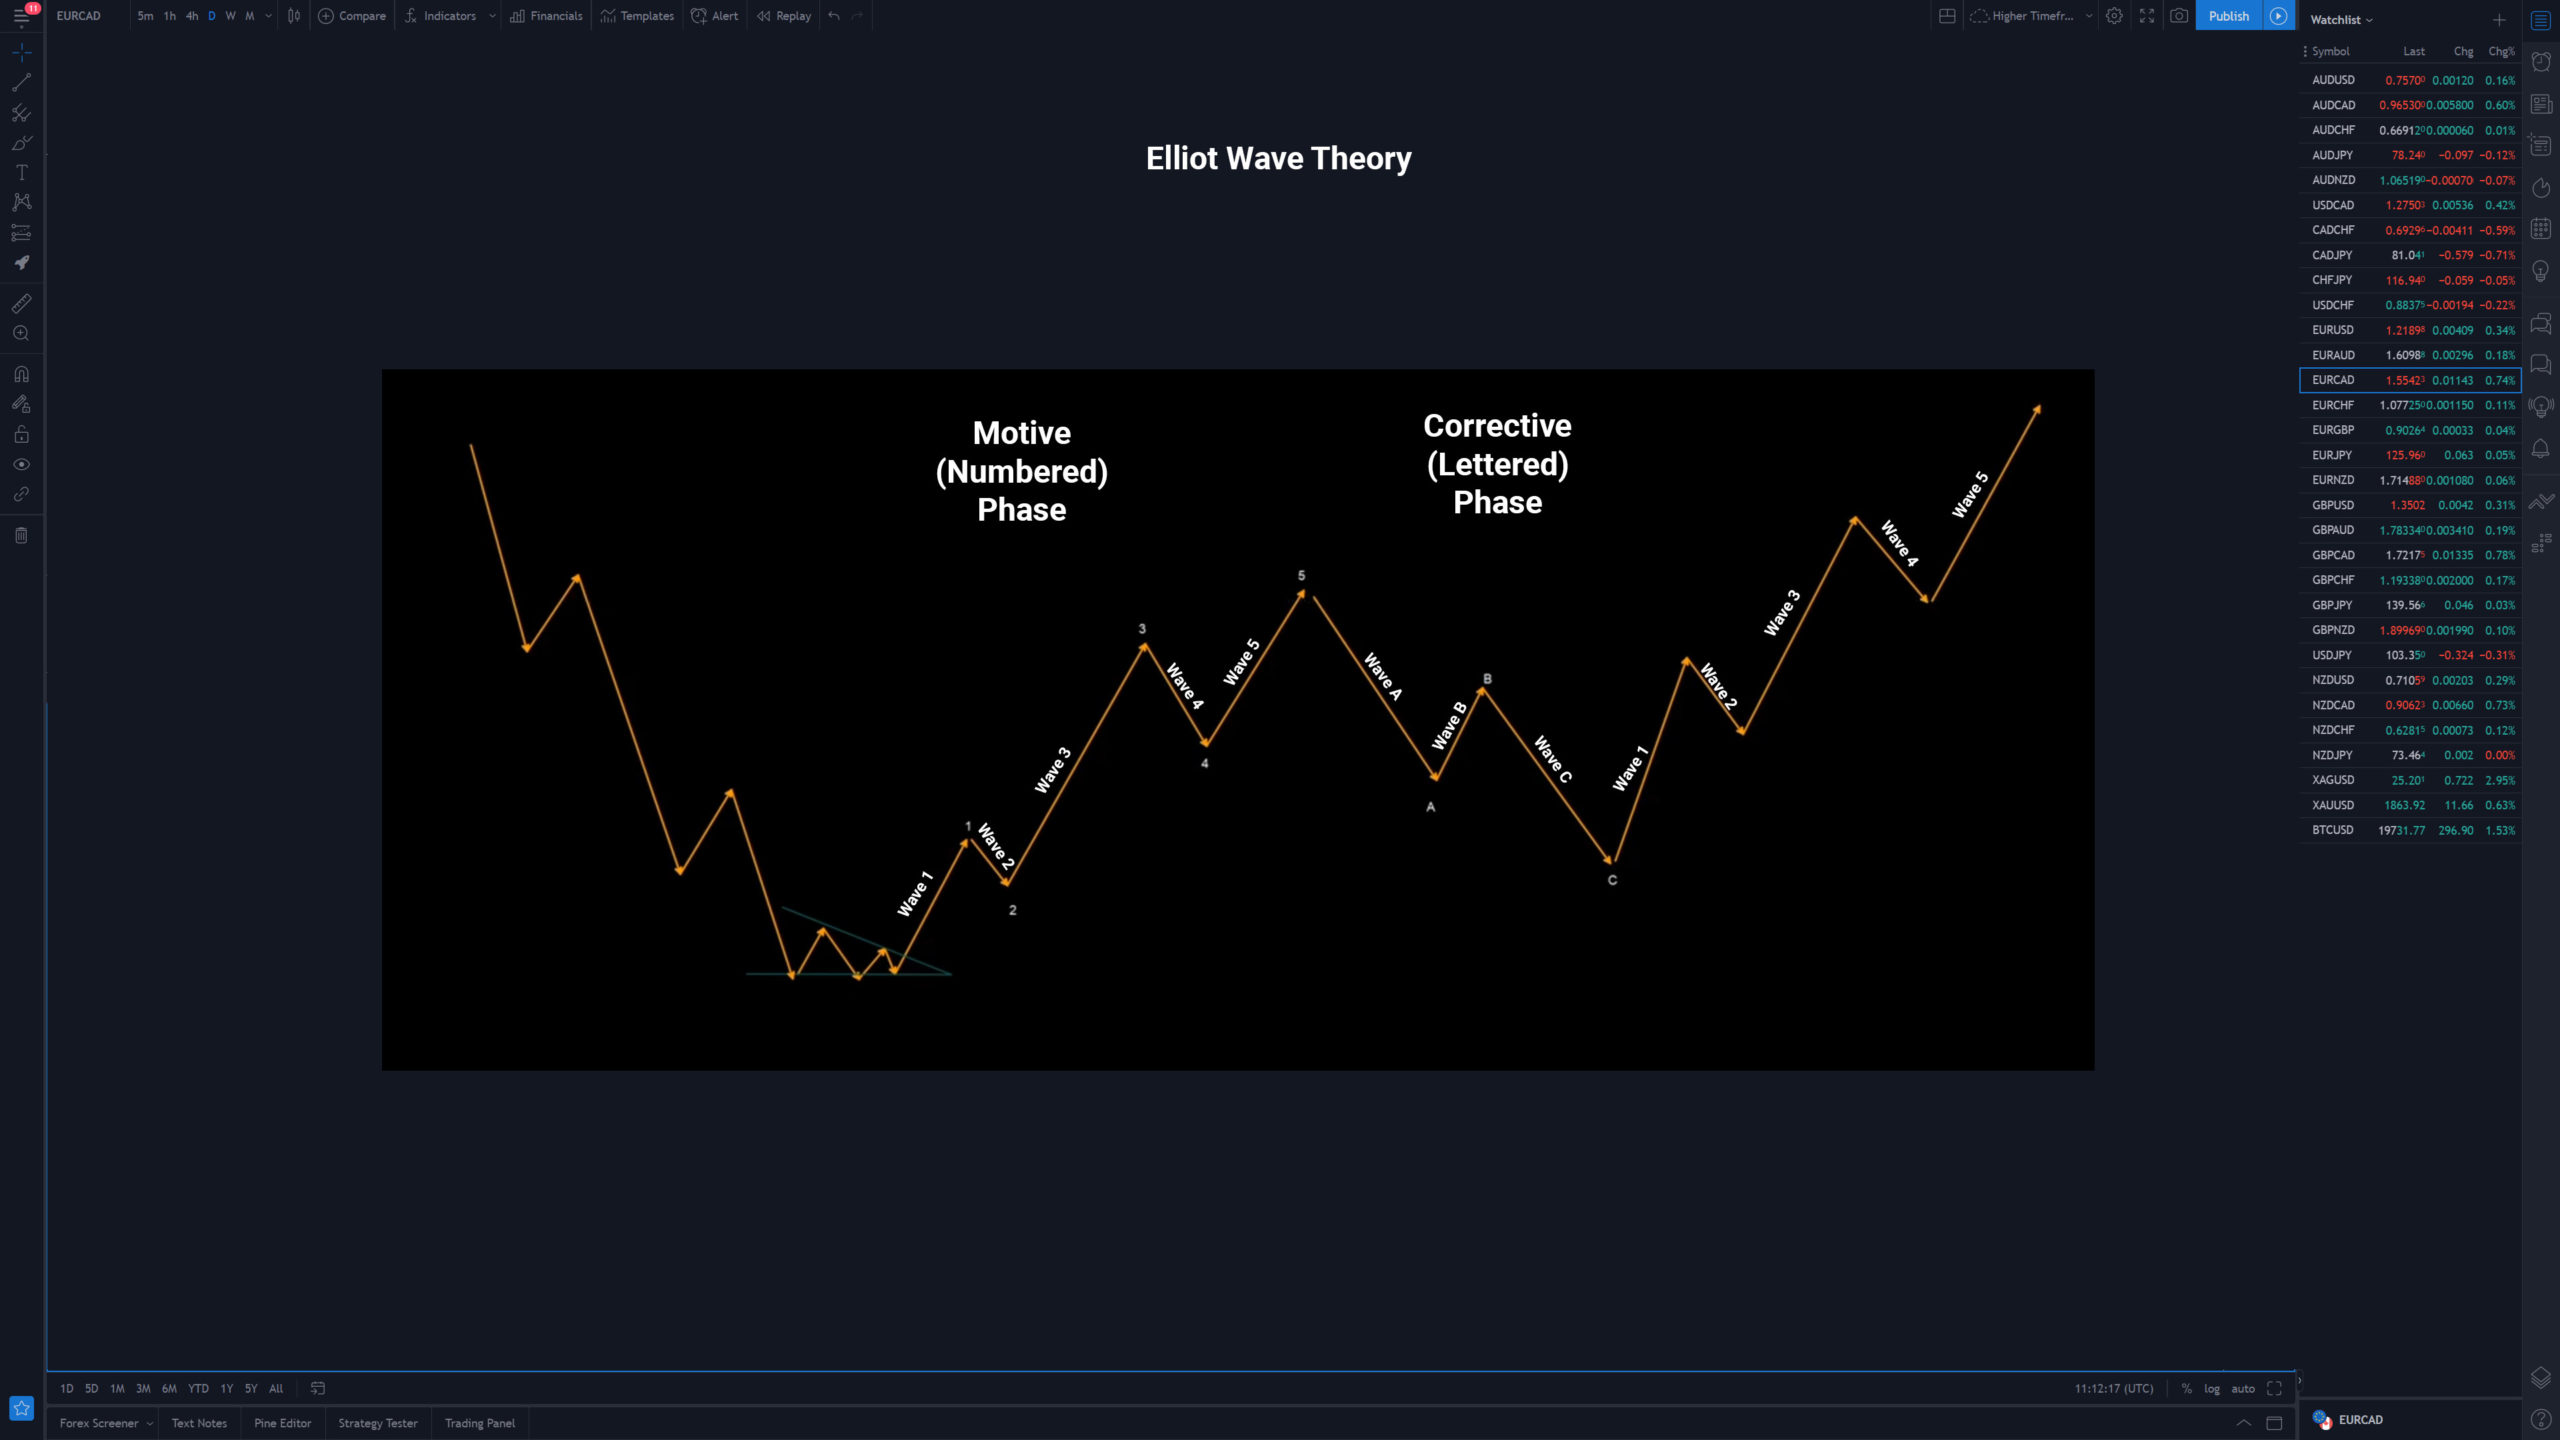
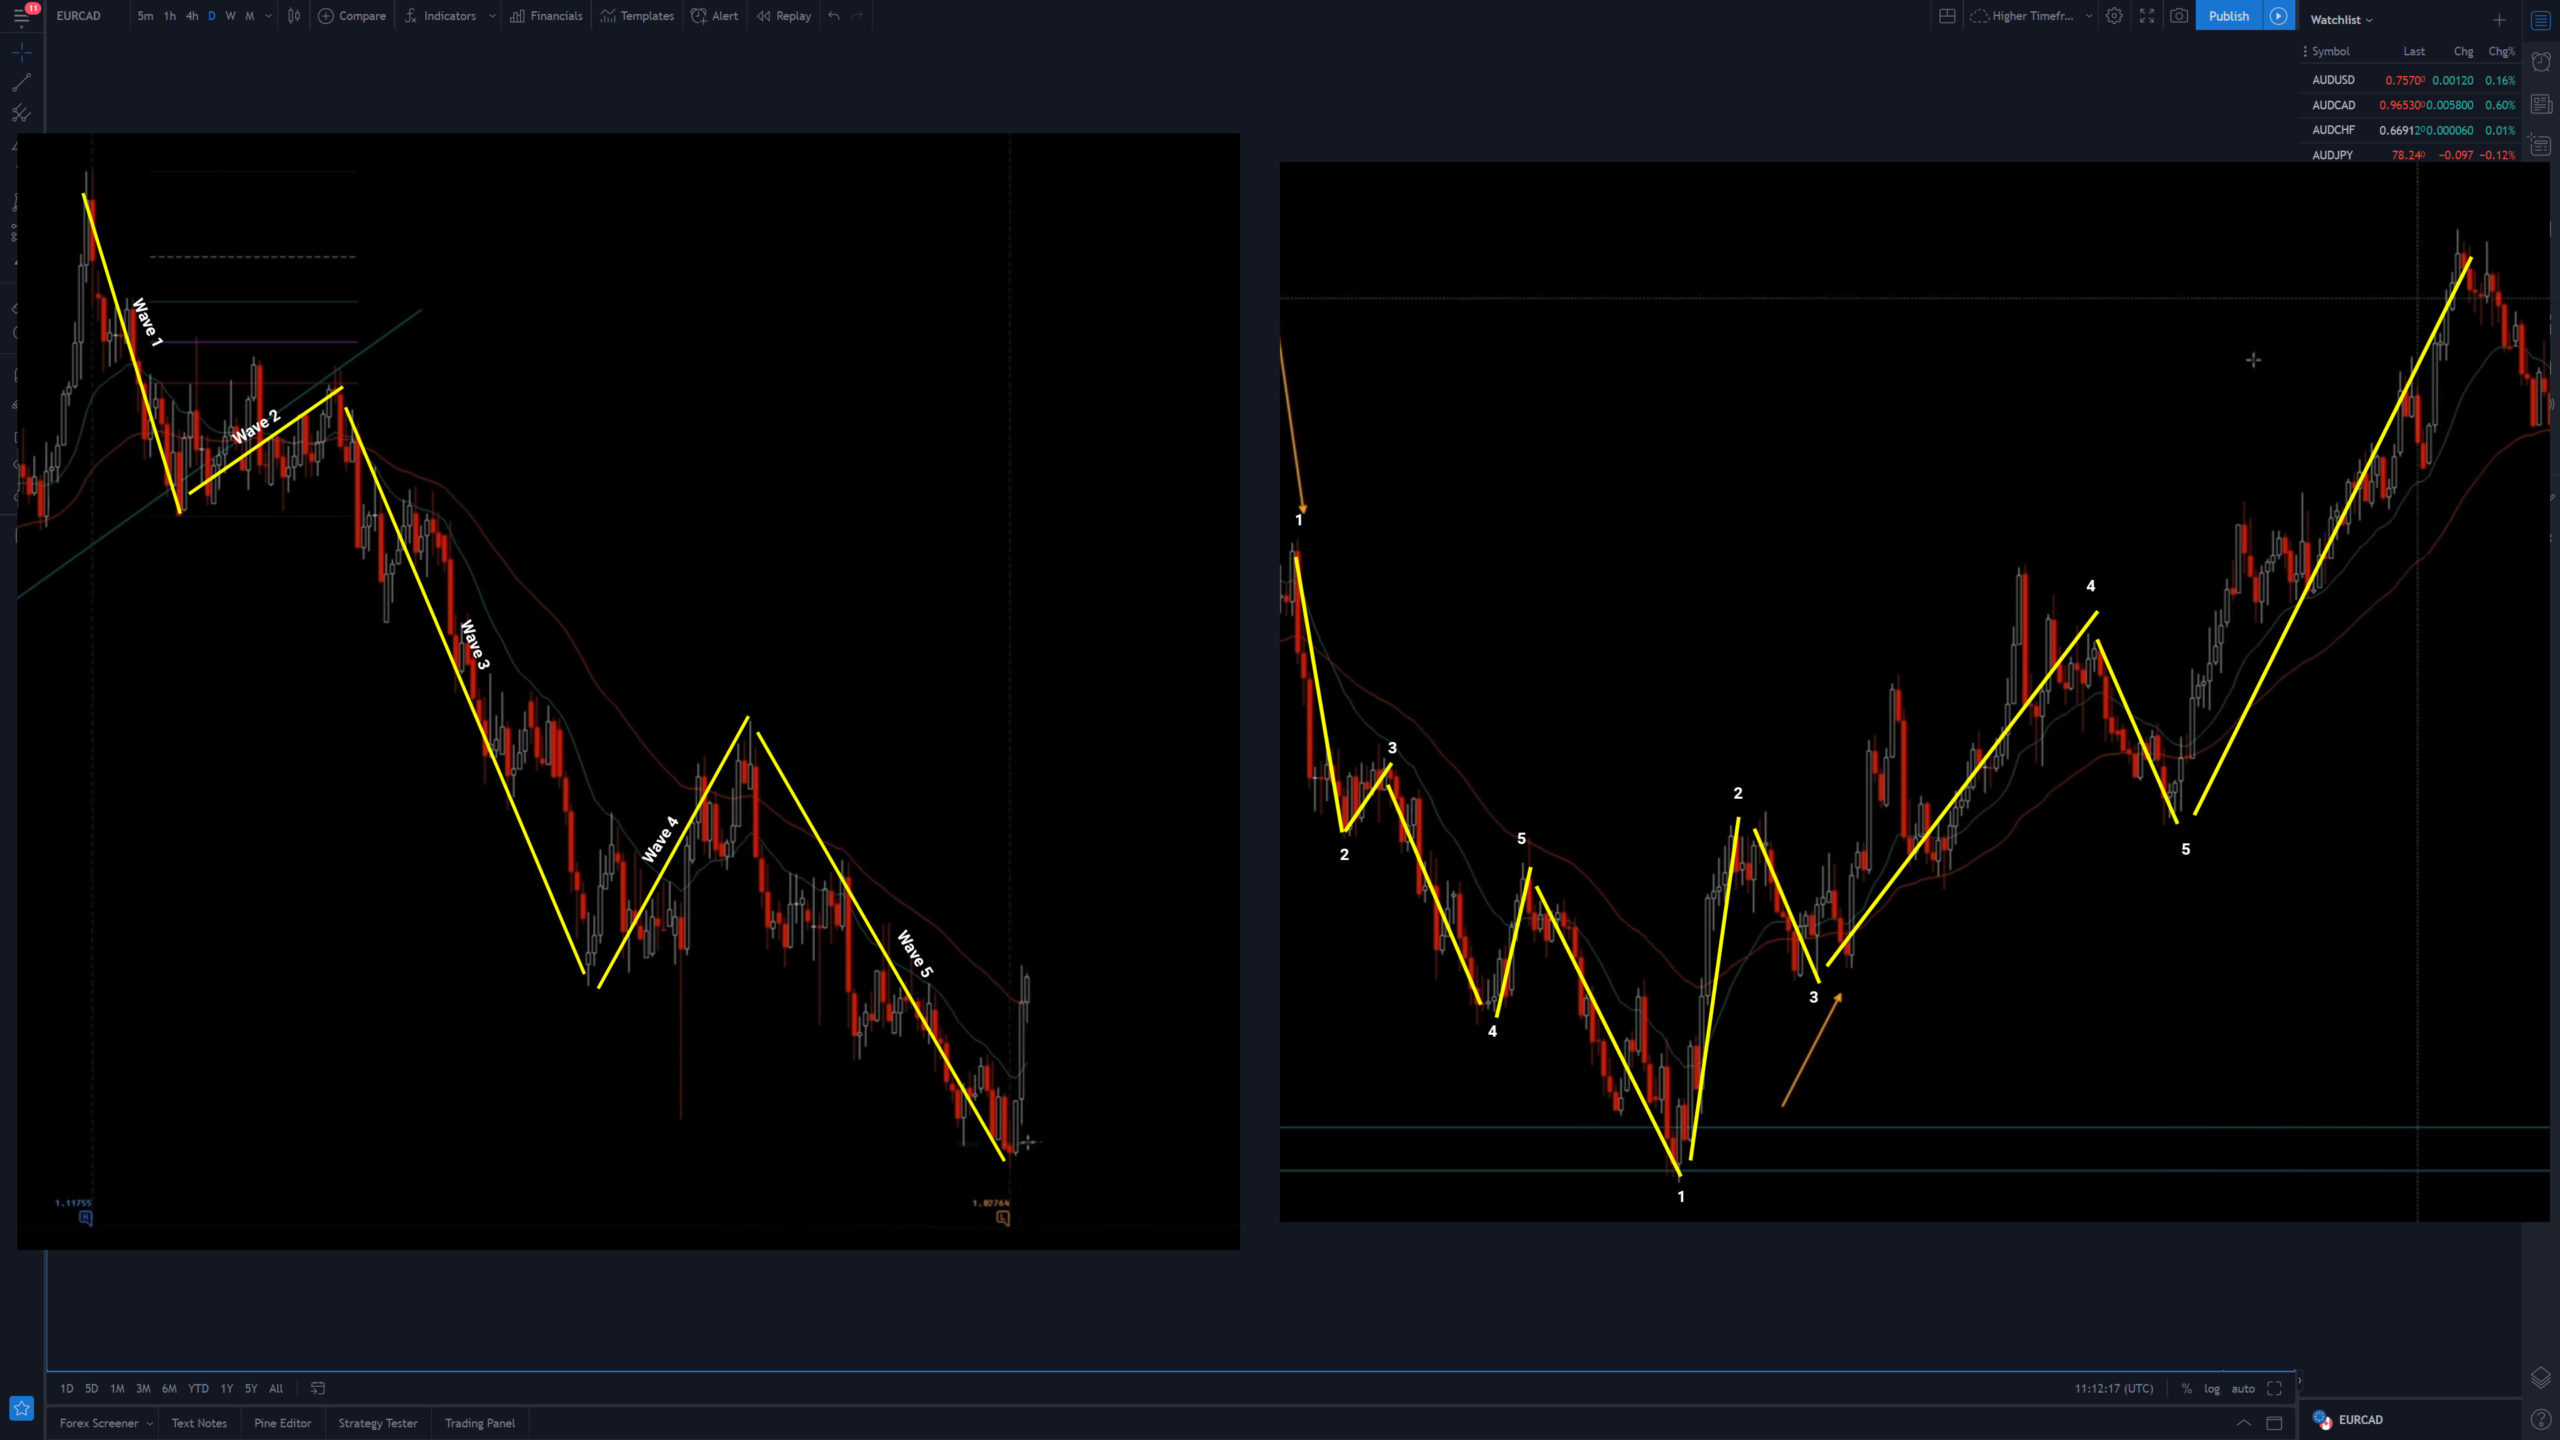
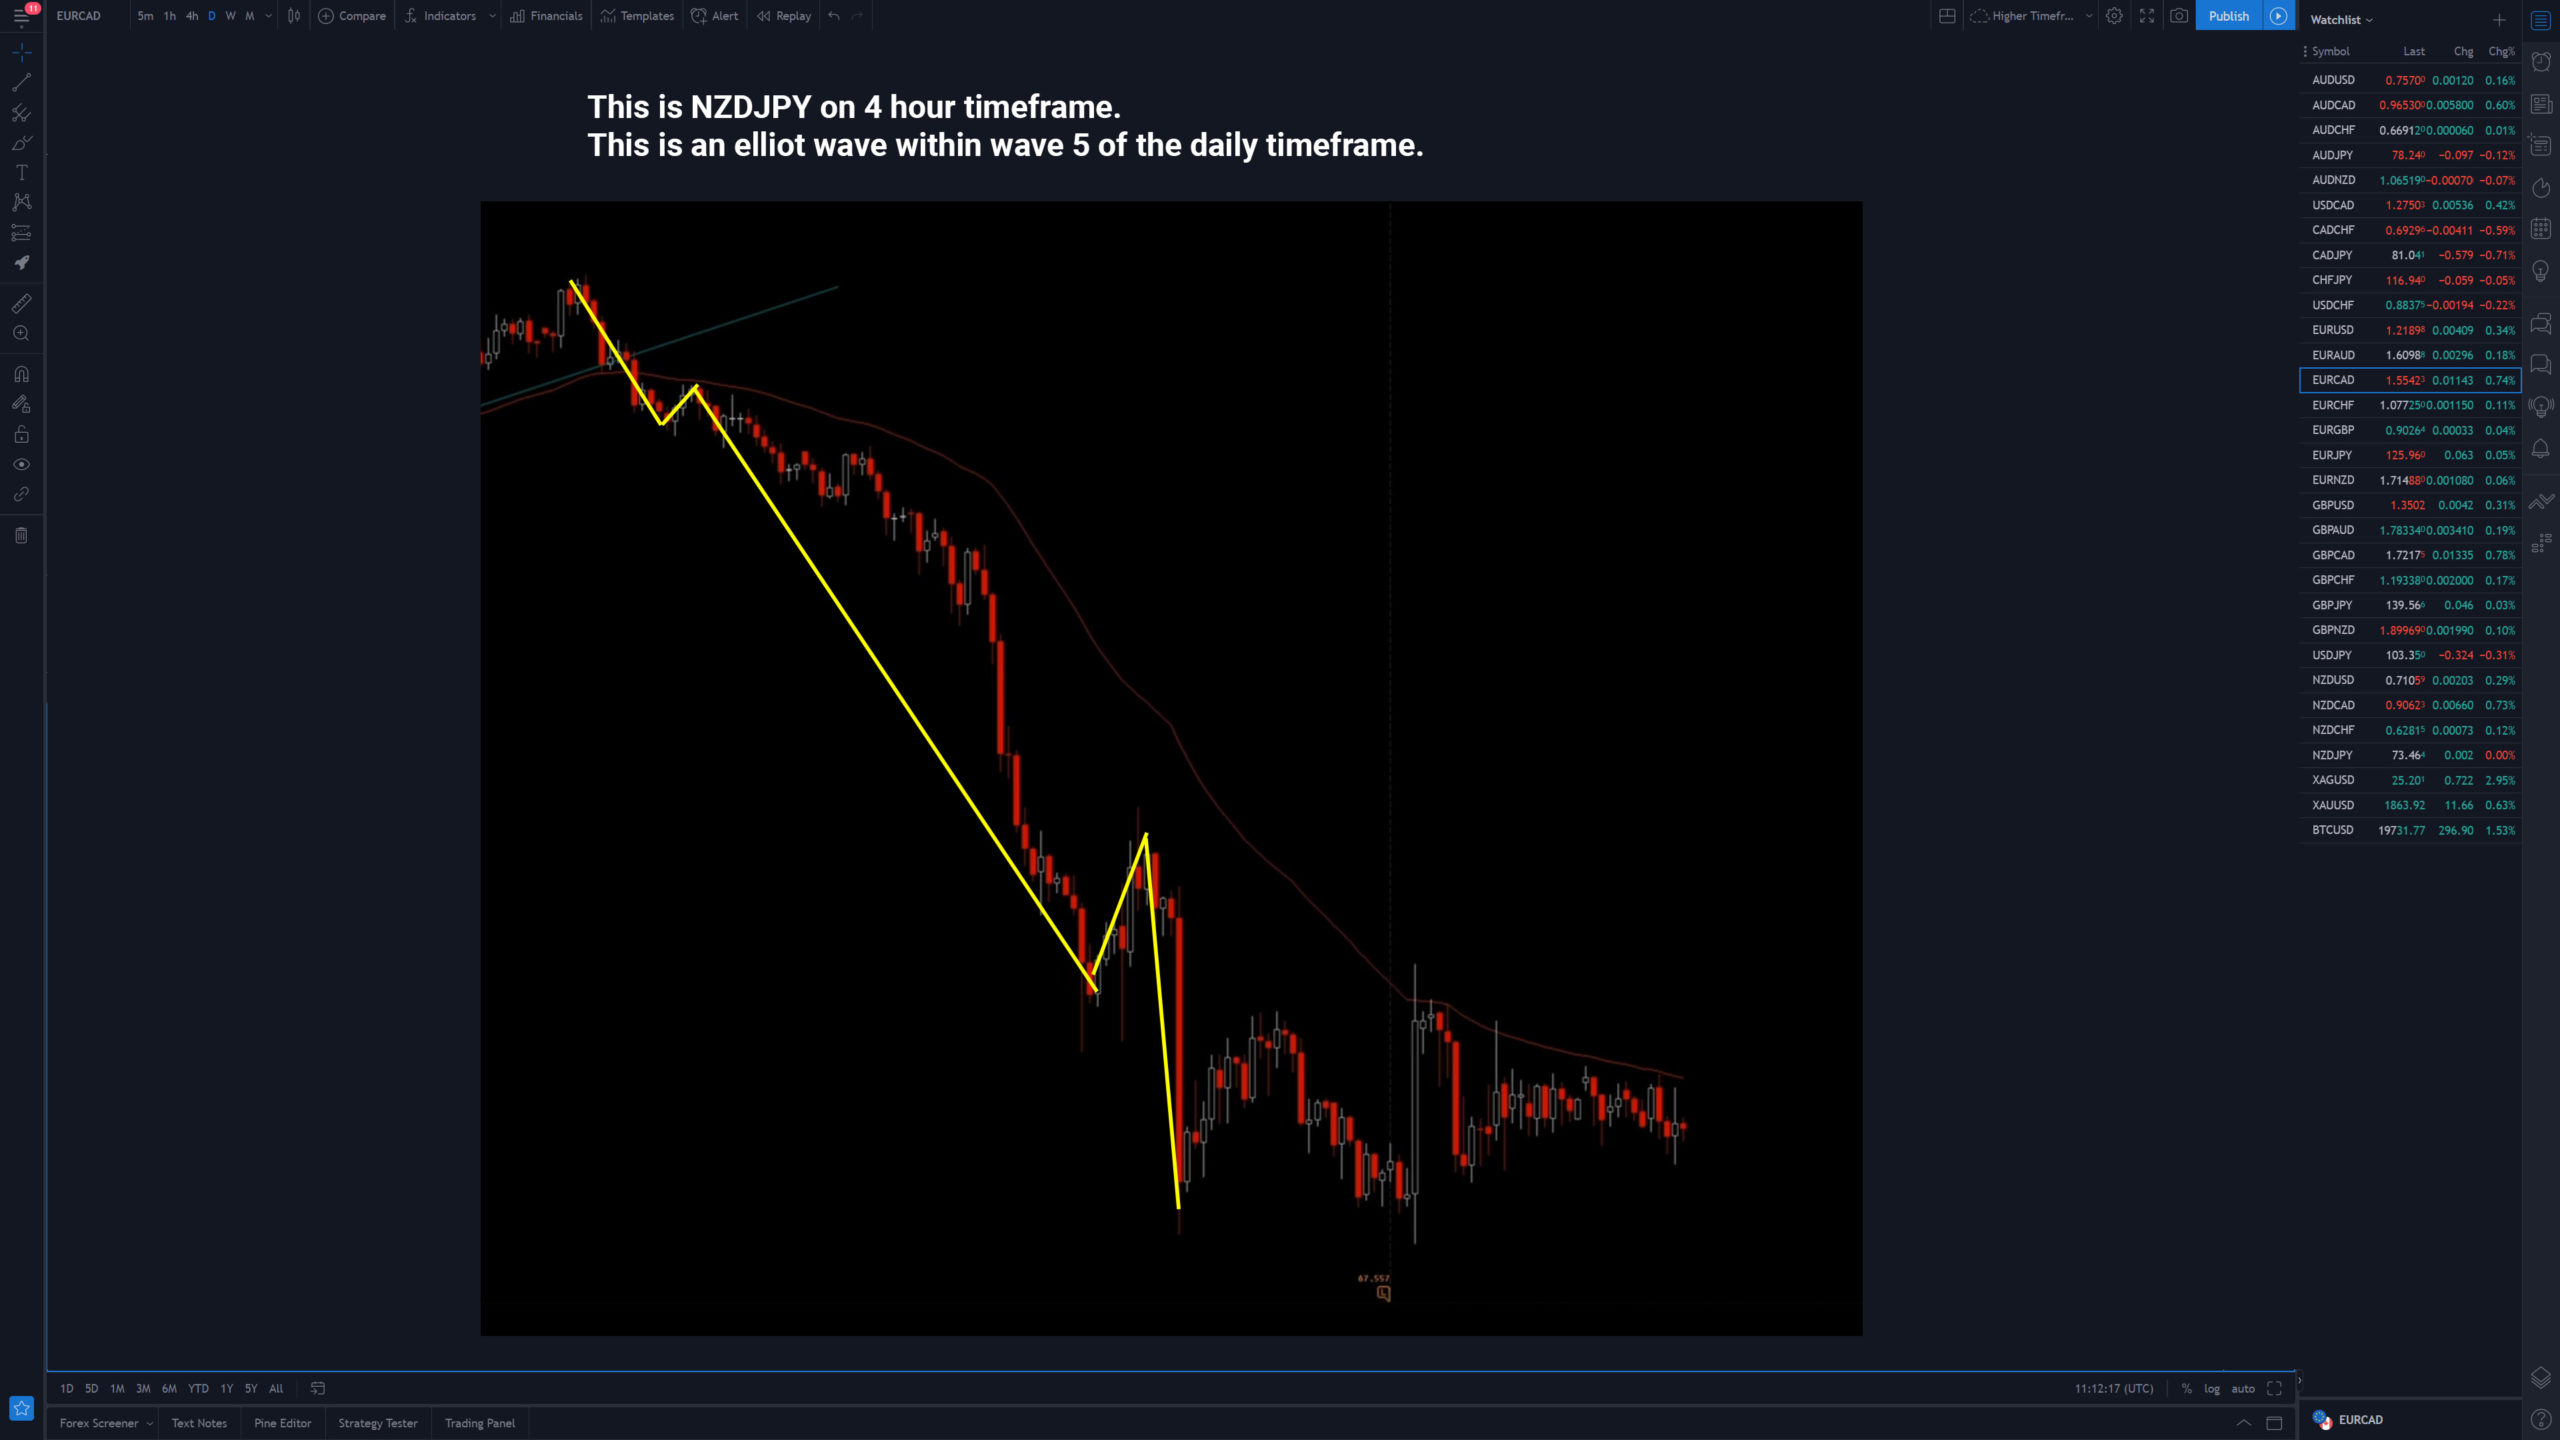
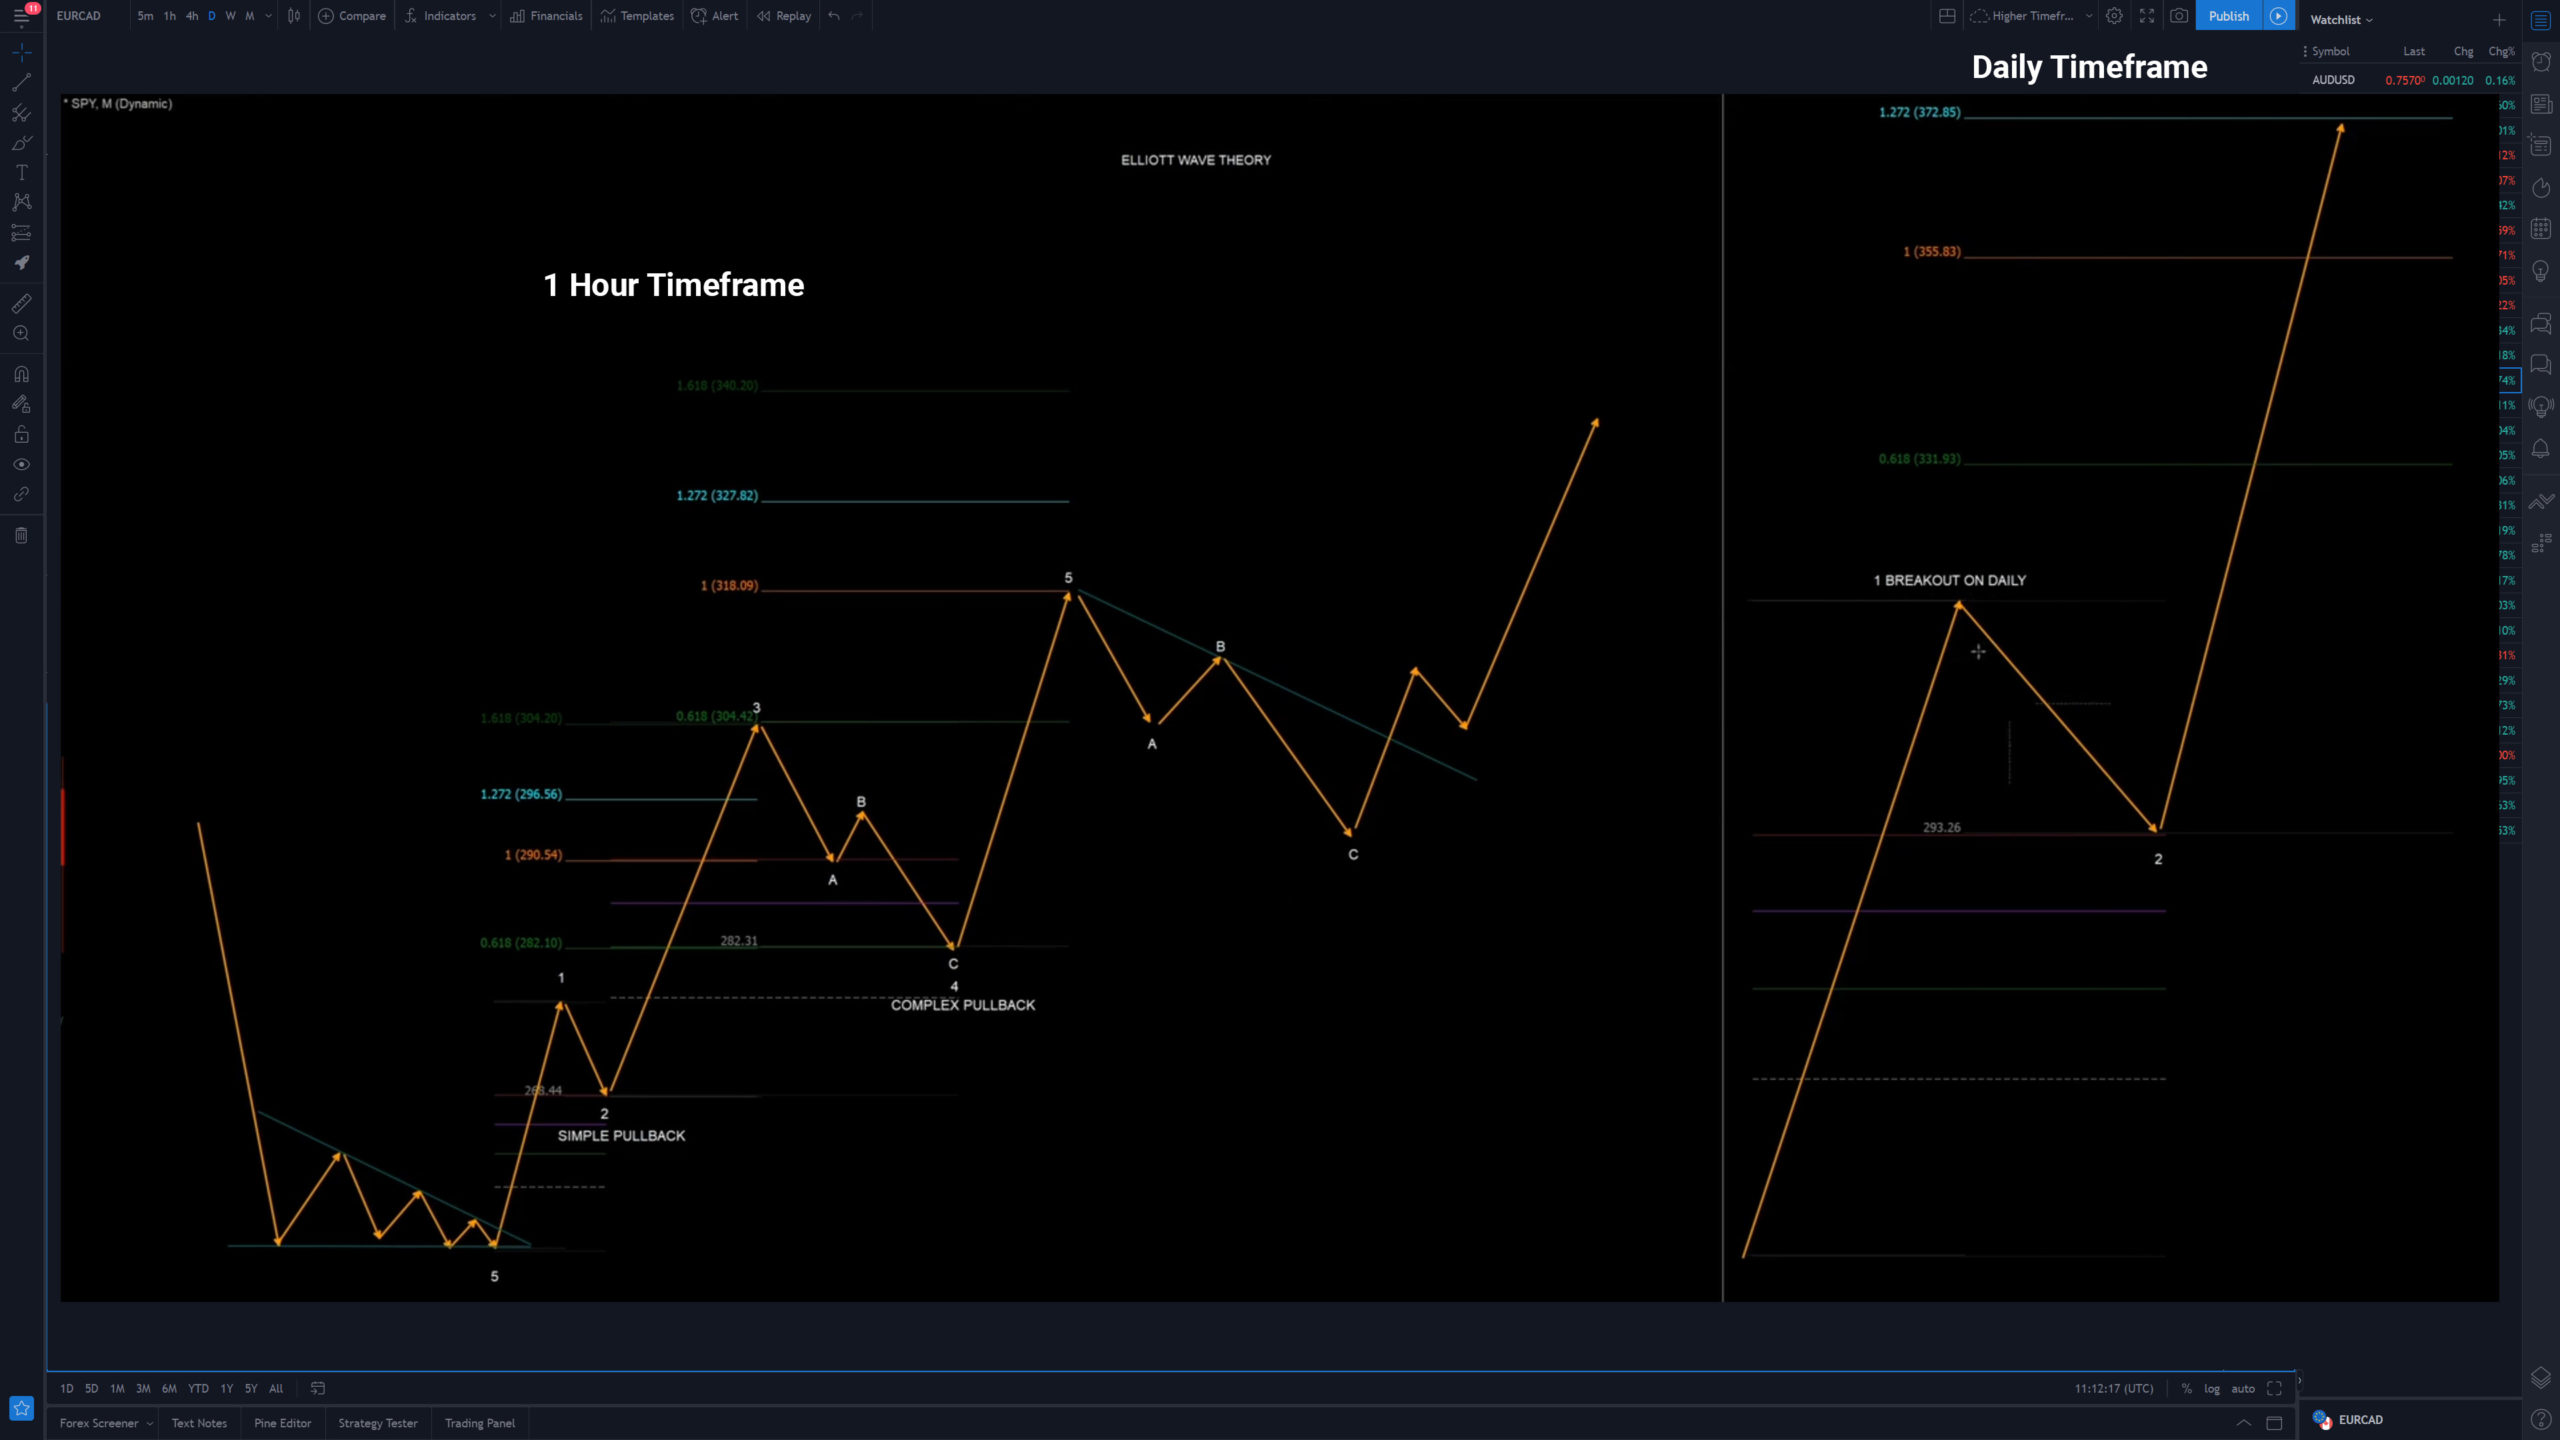
7. Elliot Wave Theory
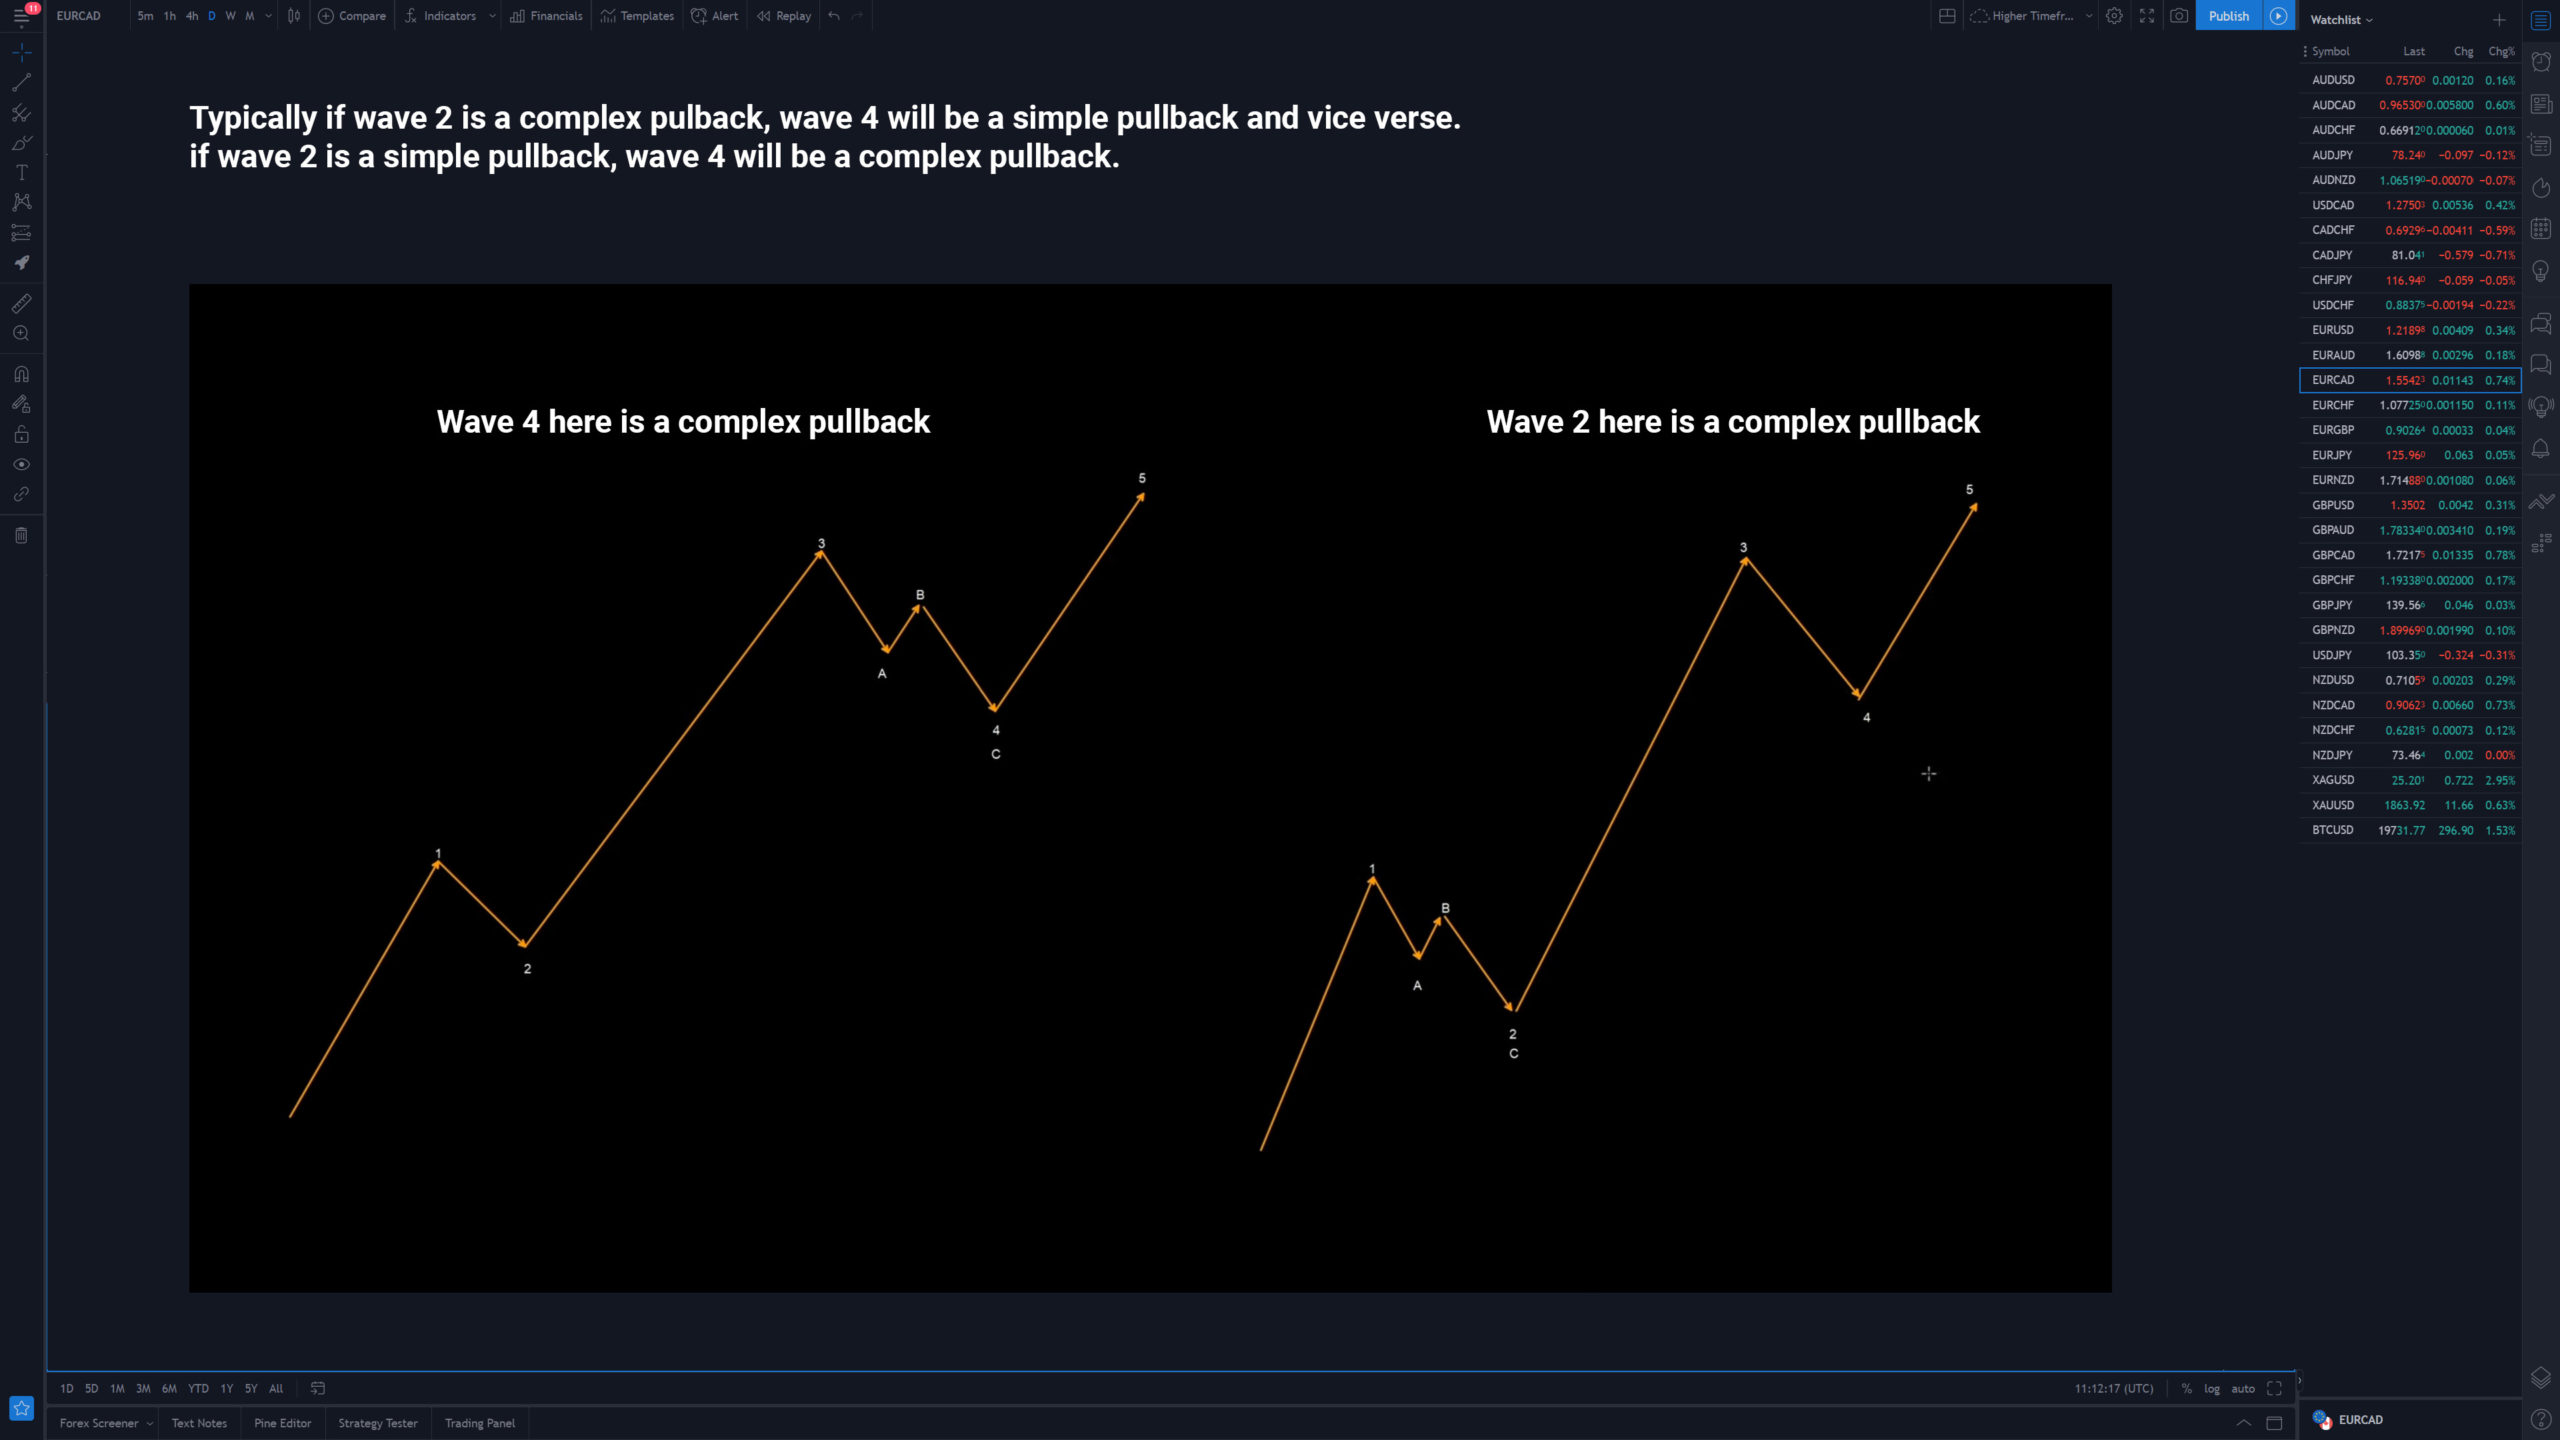
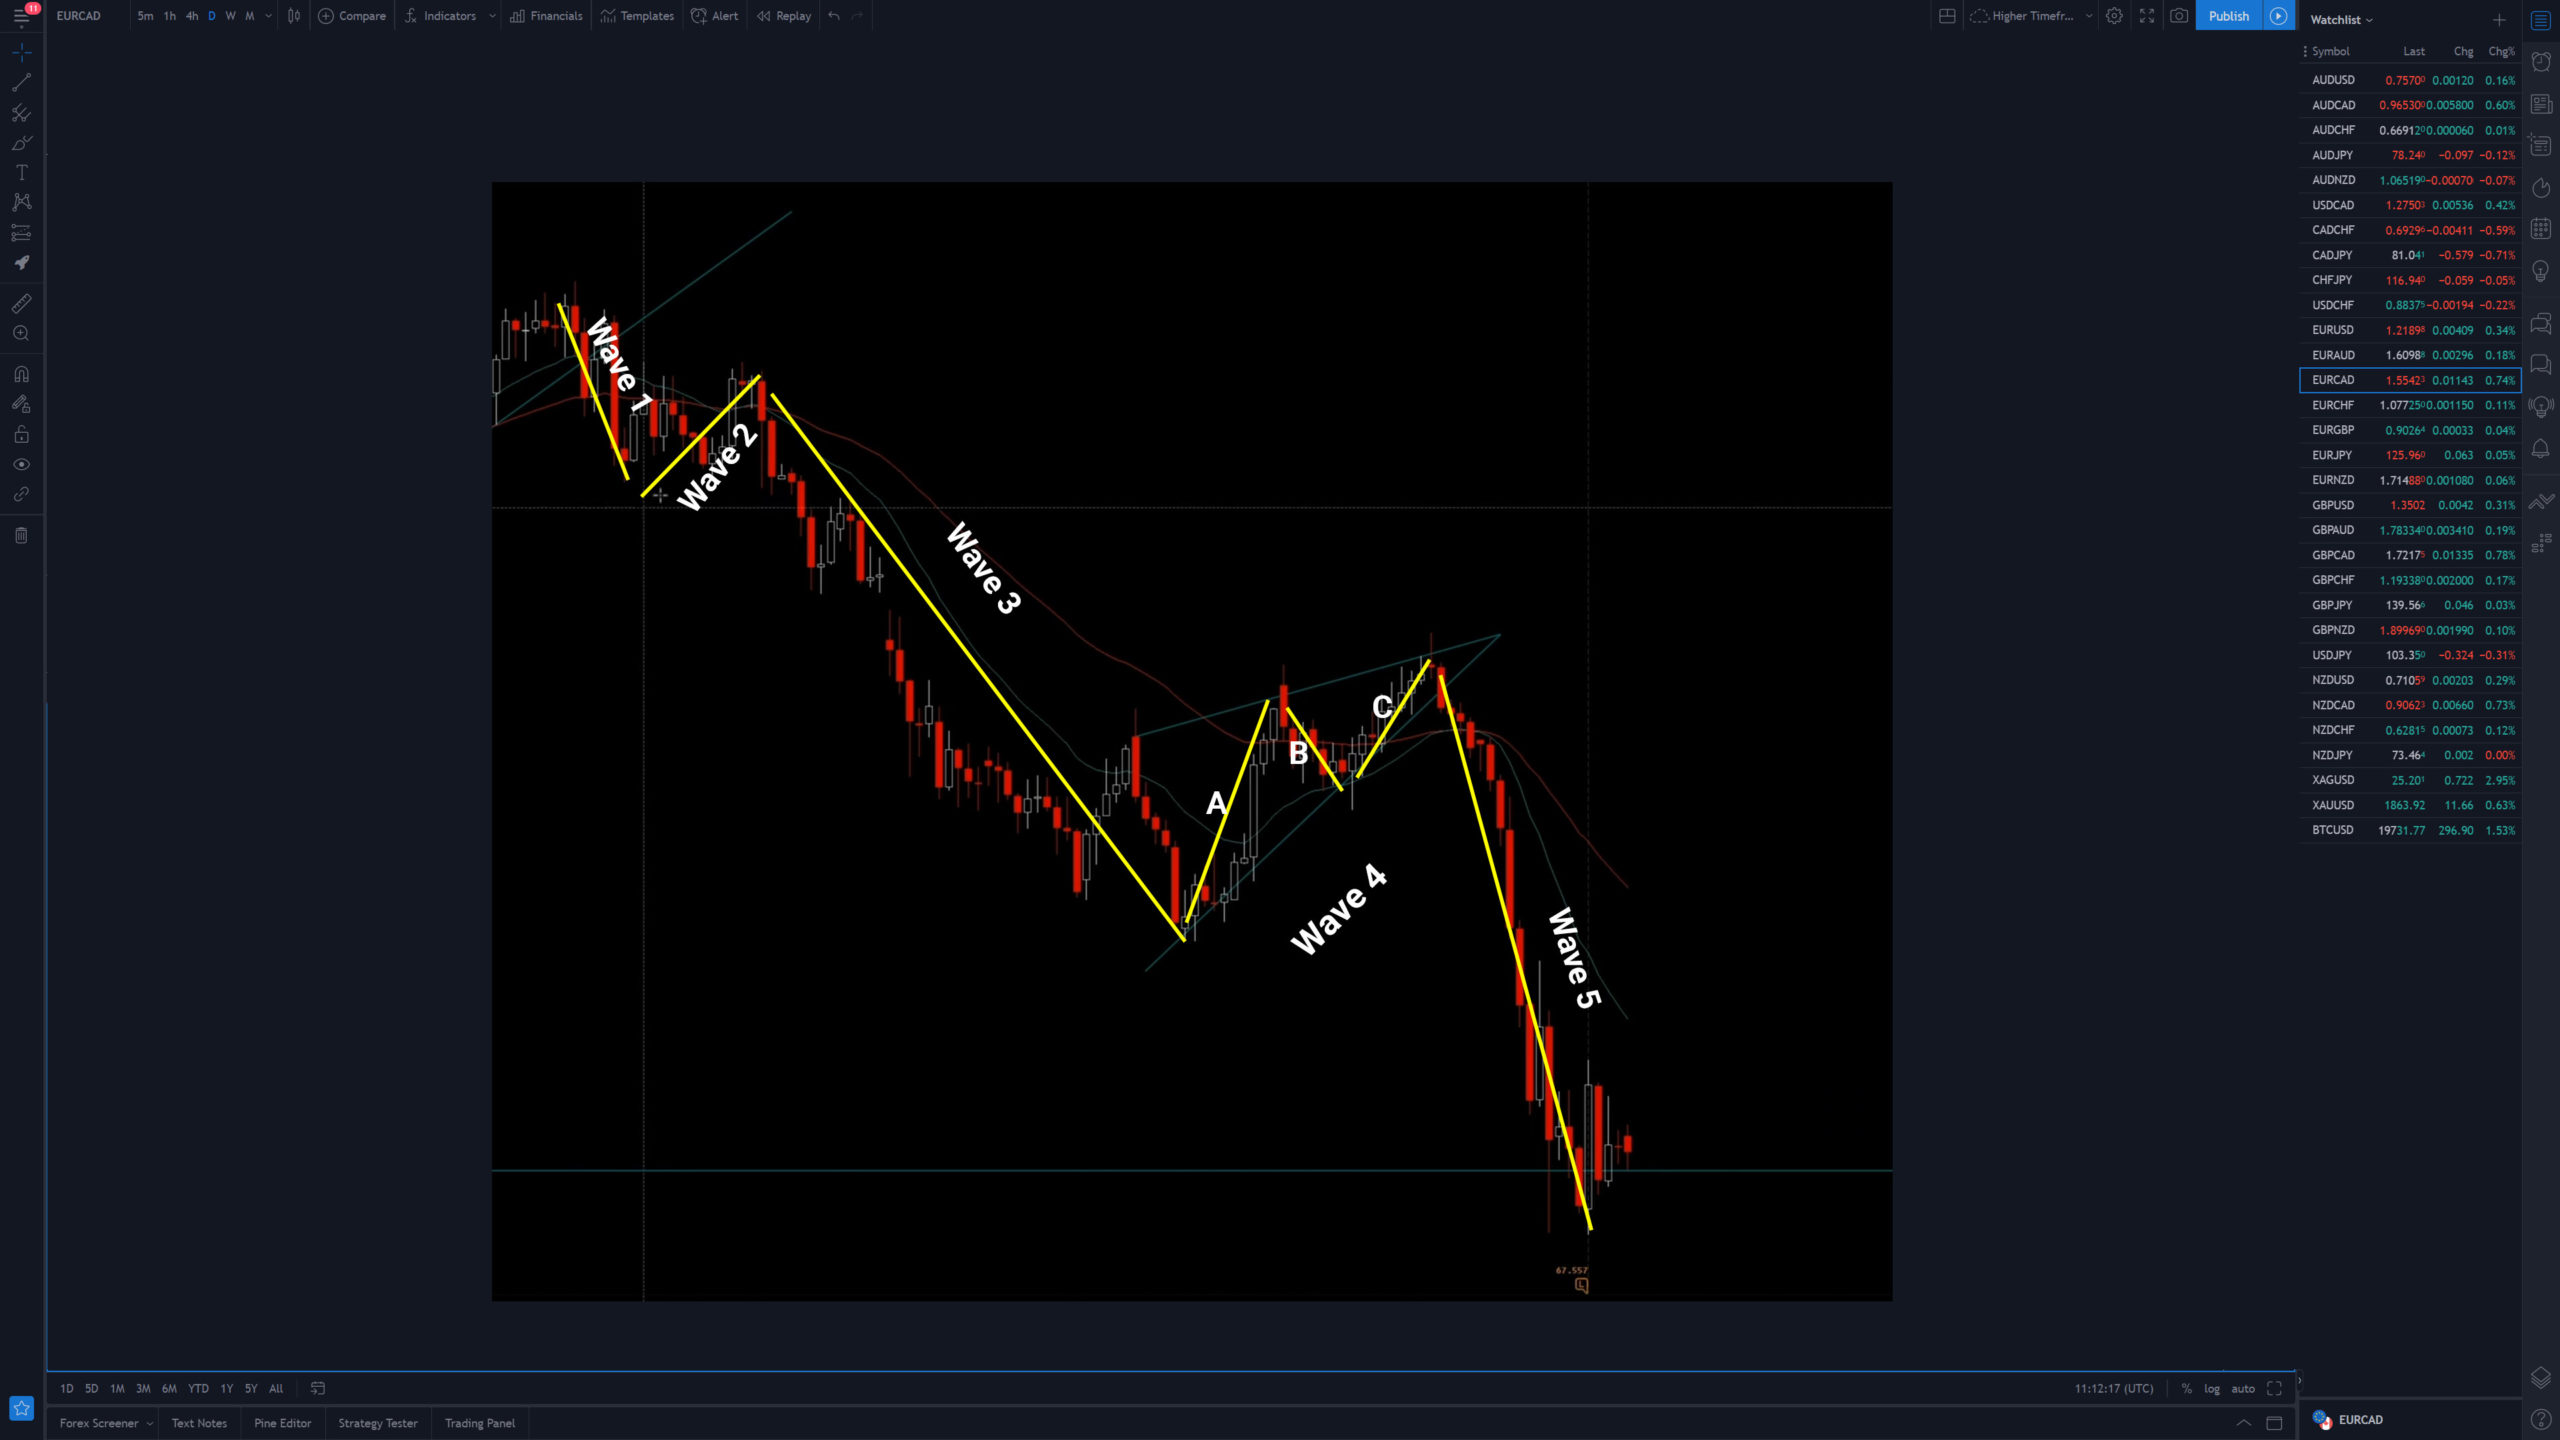
Complex Pullback Example
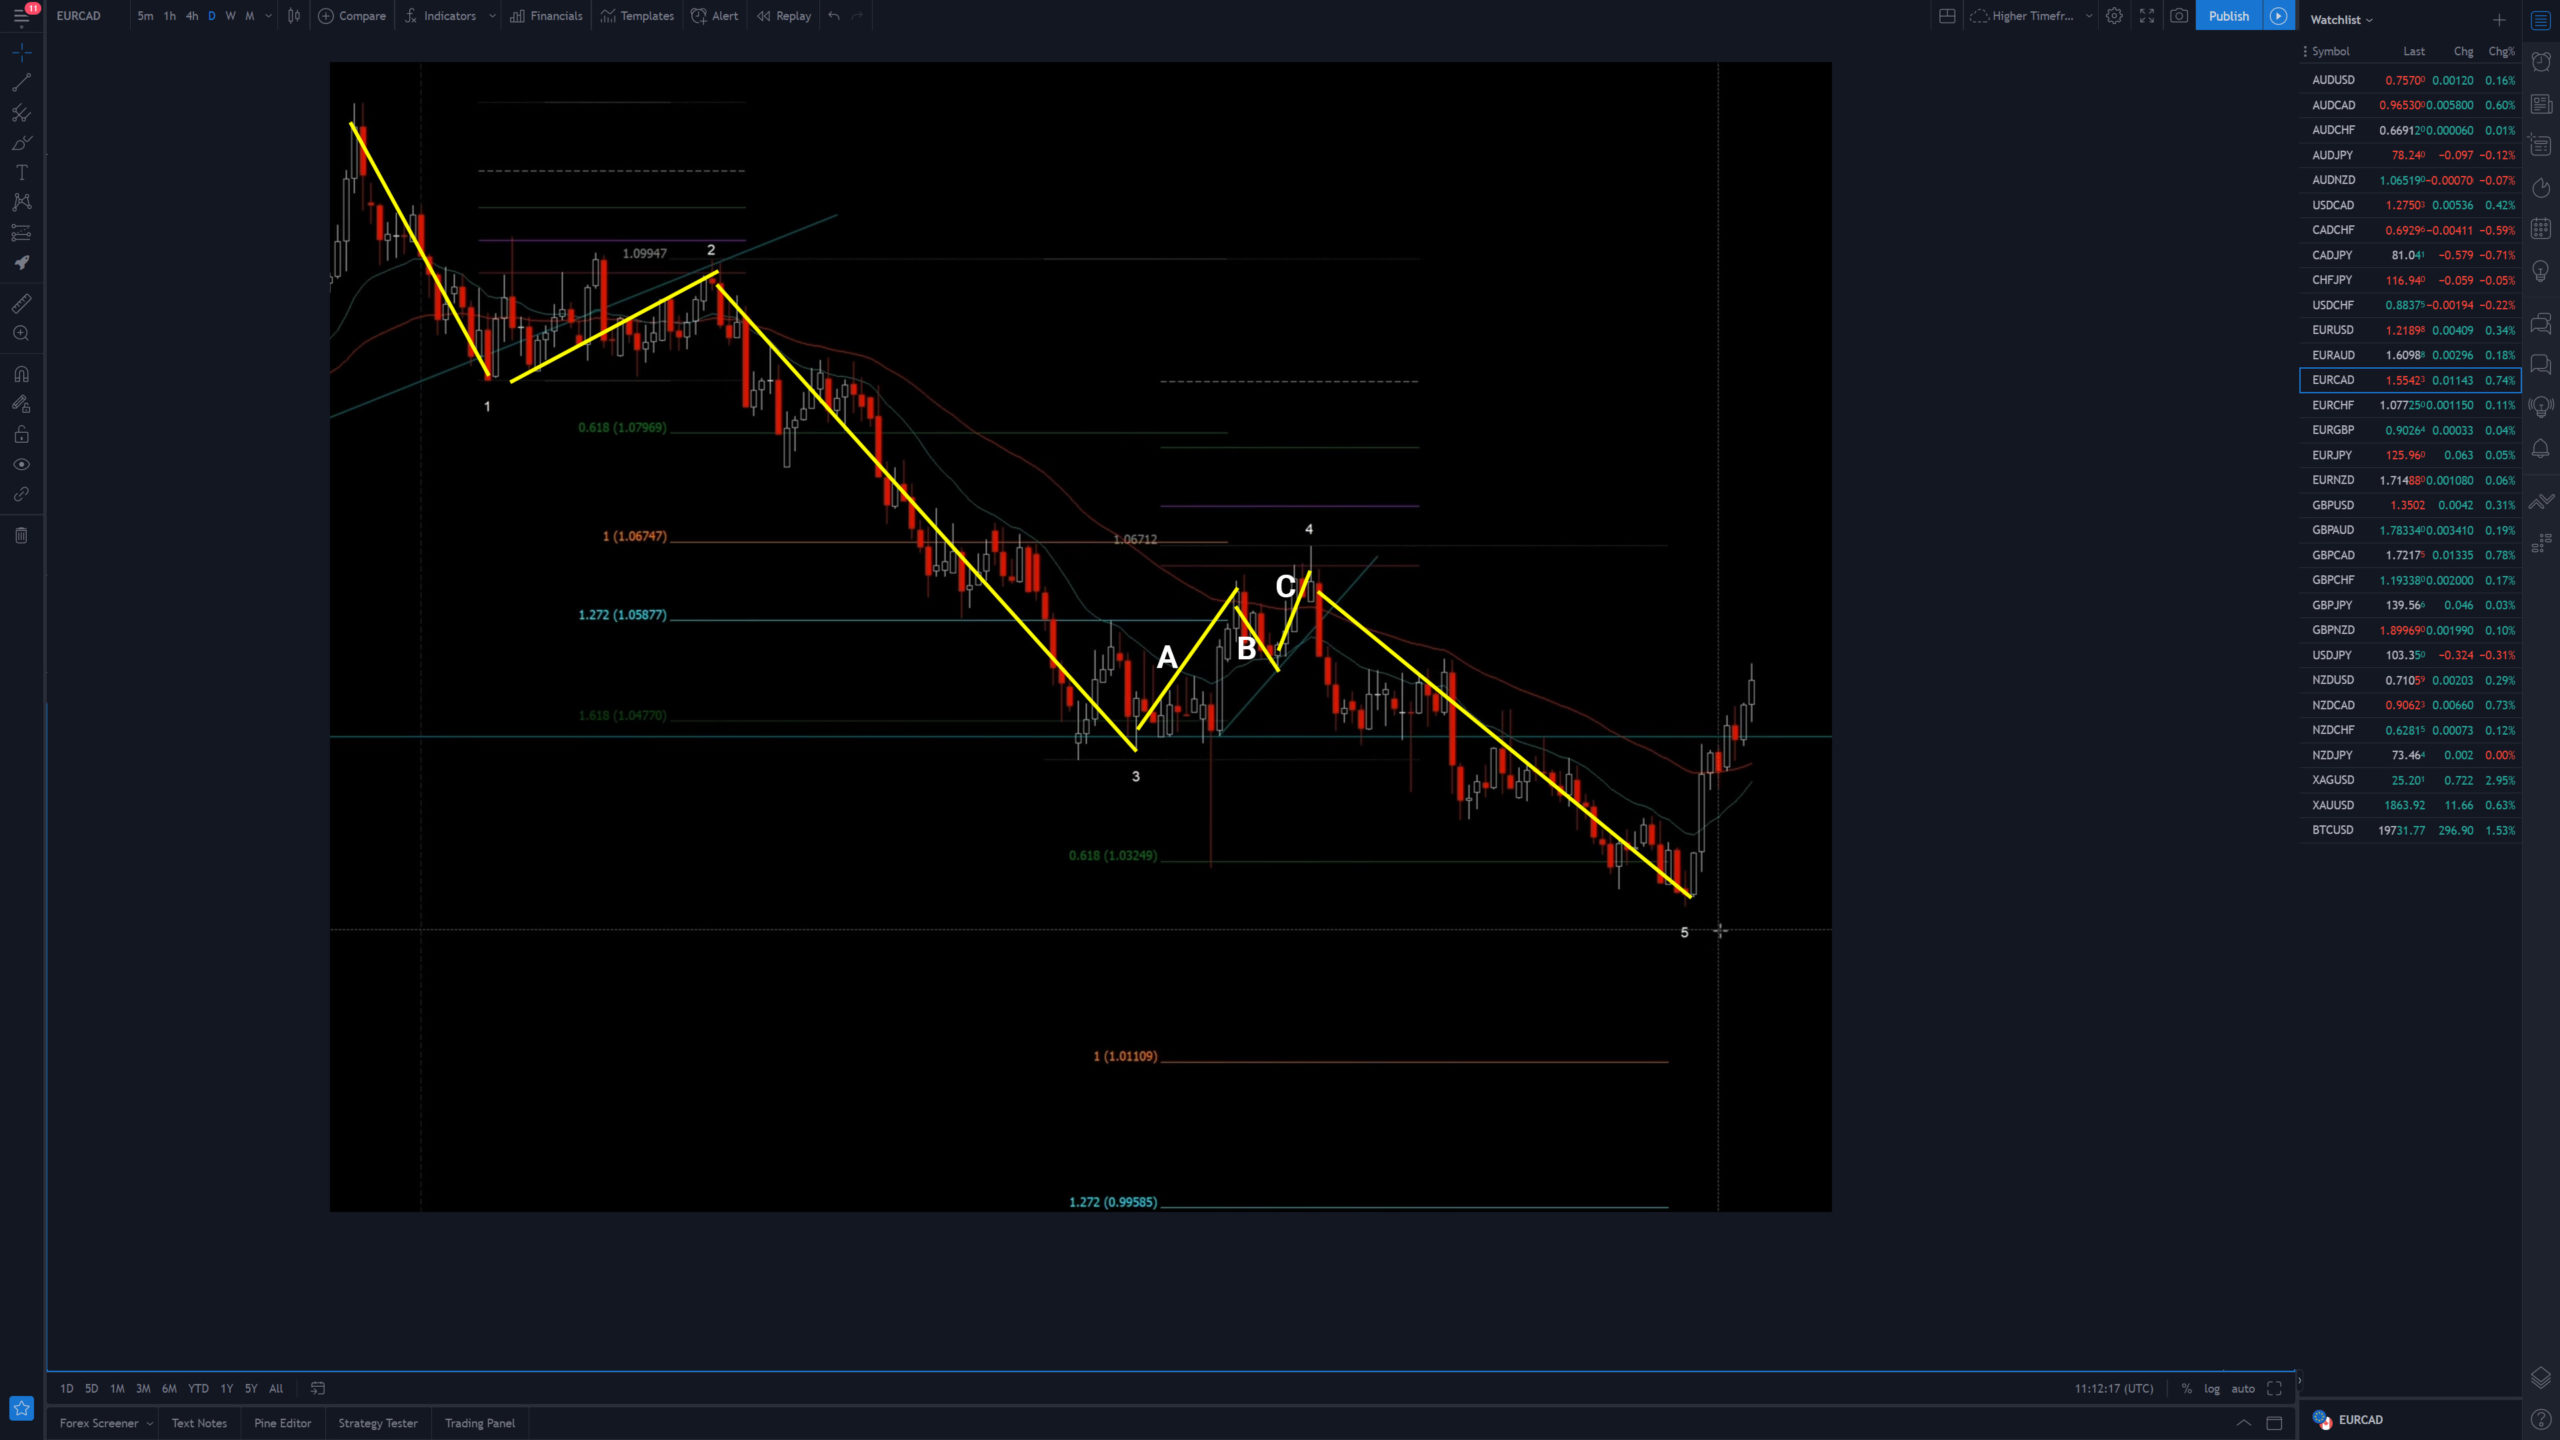
Elliott Waves & Fibonacci Retracement & Extension
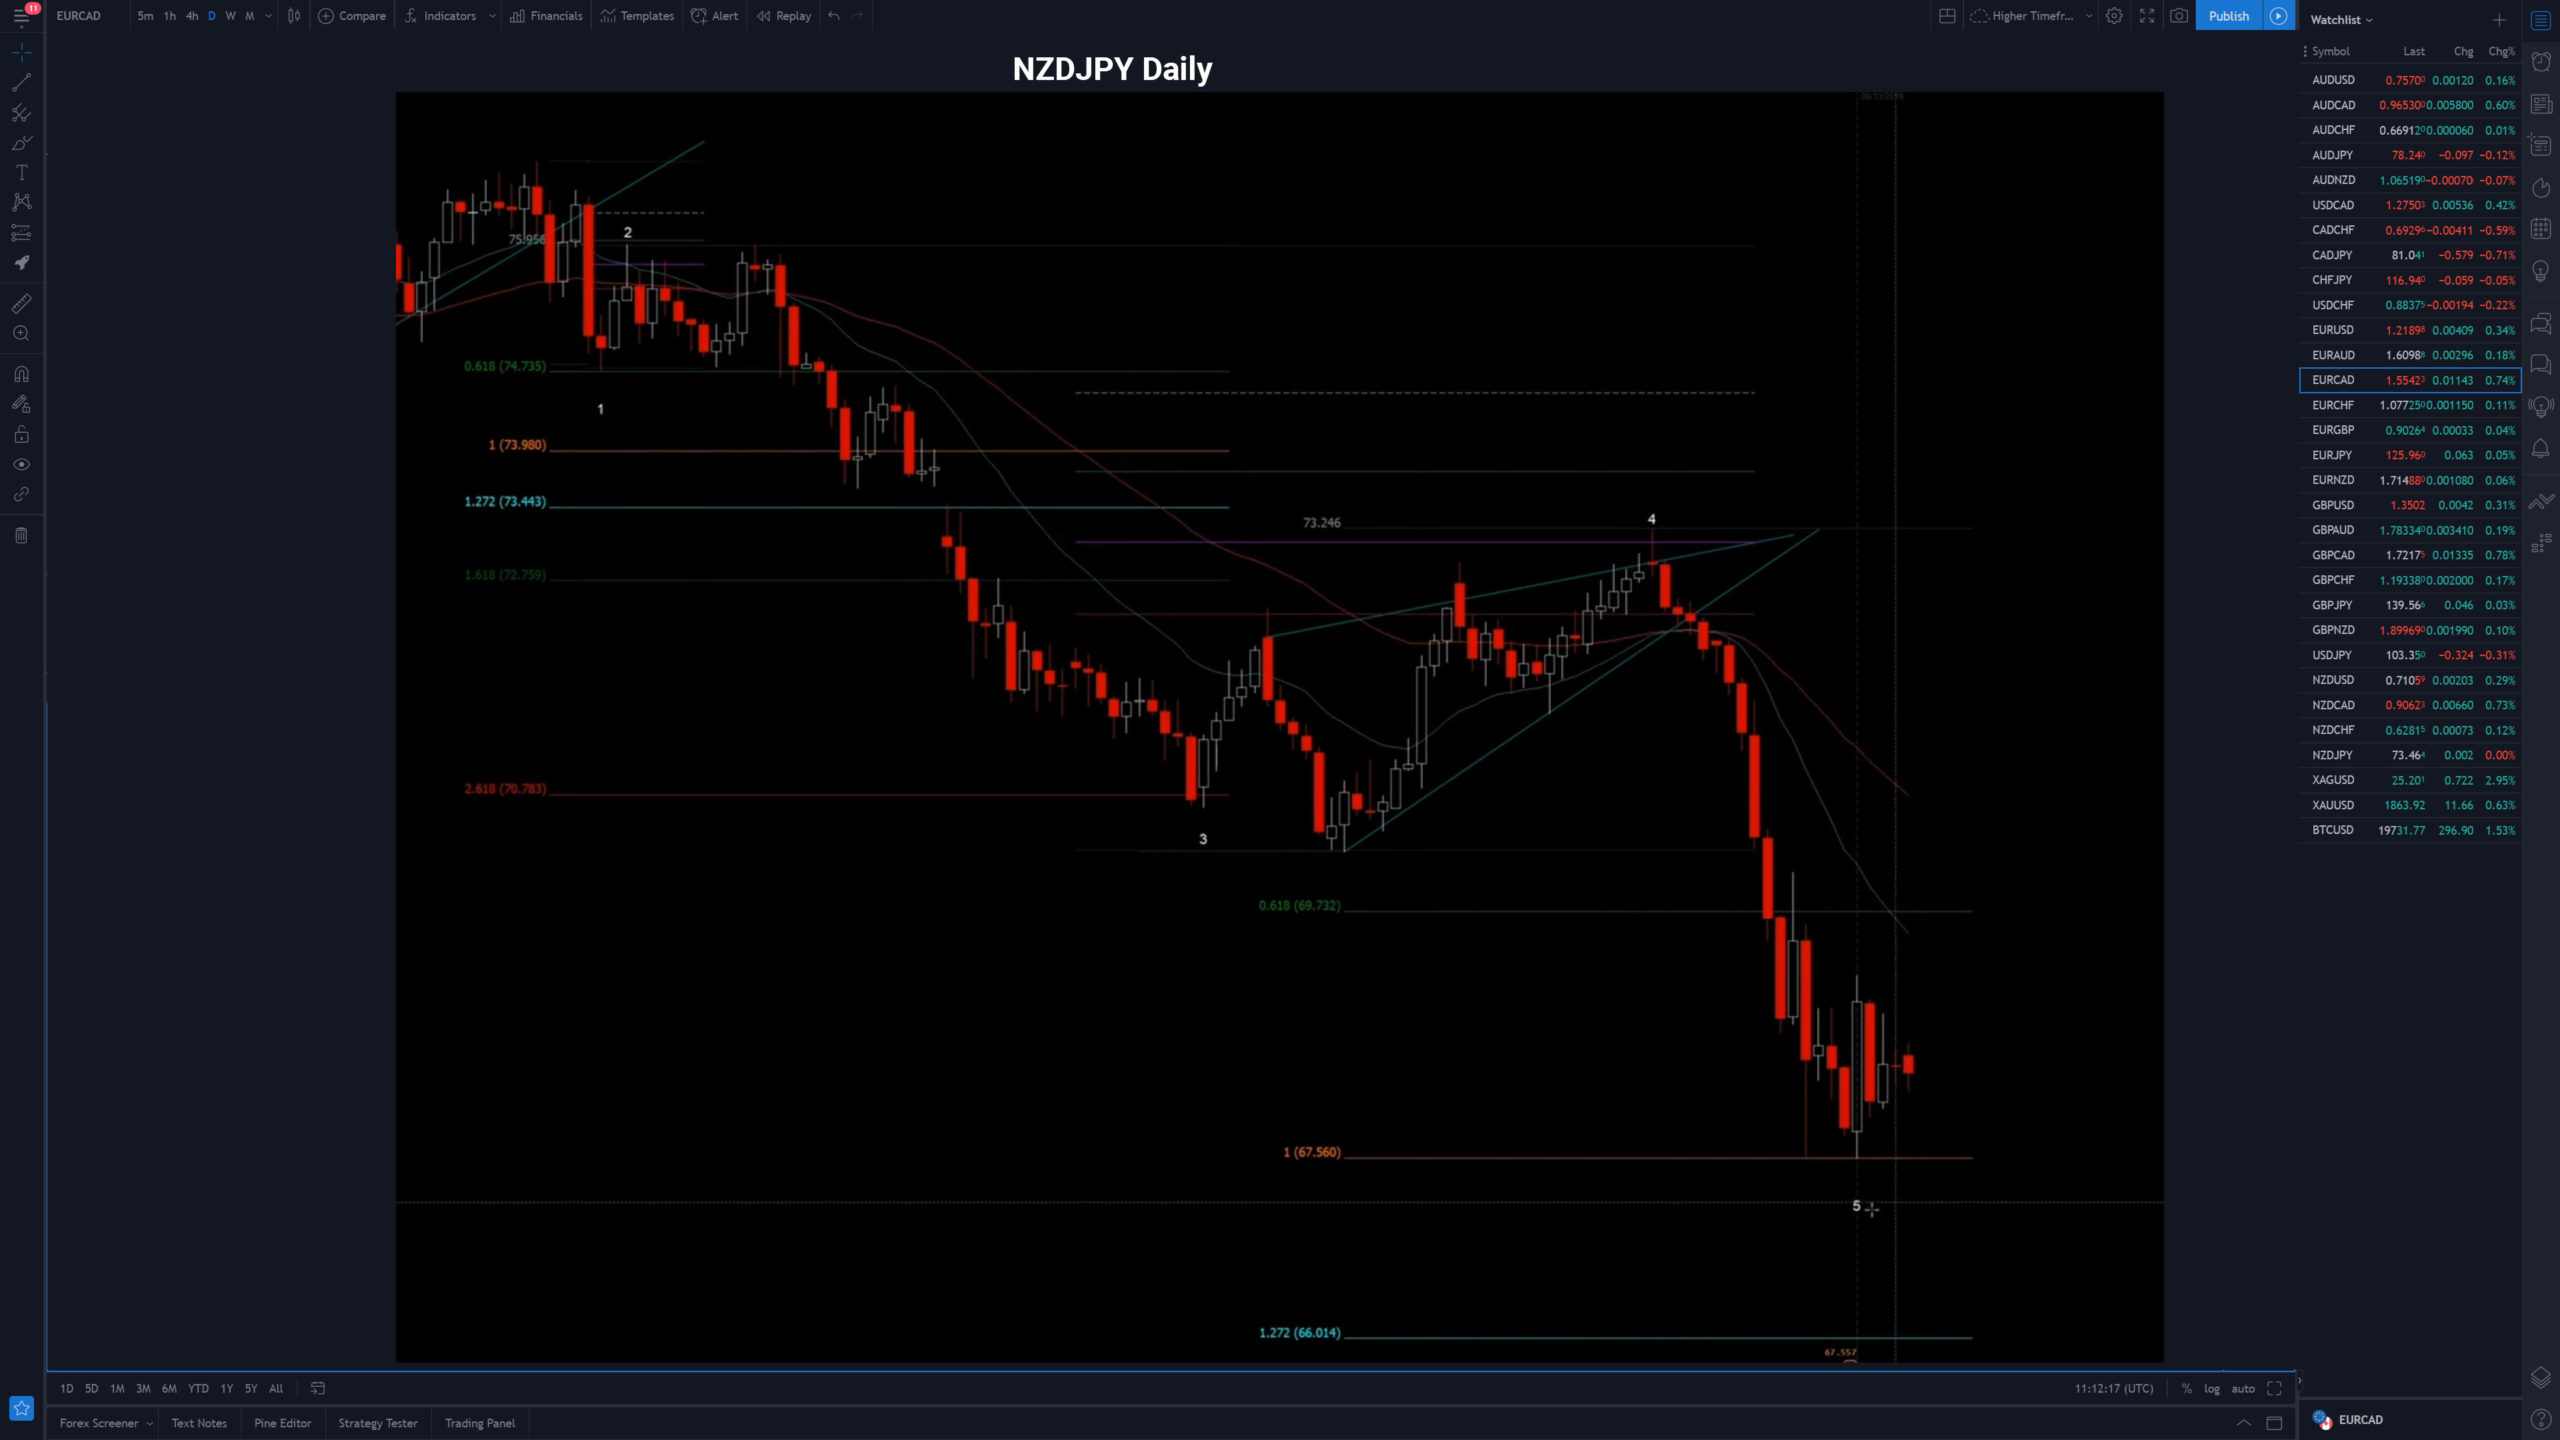
Elliott Waves & Multi-Timeframe Analysis
8.Major Trading Styles
Intro to Trading Styles Everybody is different and therefore, there are different trading styles you can focus on depending on what you’re looking to achieve. In the next few lessons, you’ll learn about swing trading, day trading, and a hybrid style of trading, which includes mixing characteristics of both day and swing together.
Long-term Trading (Swing Trading) In this lesson, you’ll learn what swing trading is, it’s characteristics, and who it’s suitable for. Swing trading can be considered more of a part-time trading approach. Swing trading is good for those who love their job and want to trade part-time. It’s also great if you are travelling.
When you hold a position for over a week. Even 1-3 months. You focus on higher timeframes.
Short-term Trading (Day Trading) In this lesson, you’ll learn what day trading is, it’s characteristics, and who it’s suitable for. Day trading can be considered more of a full-time trading approach.
Day Trading is full-time. You focus on the lower timeframes, but you still need to check the higher timeframes. You have to make your watchlist every single day! Positions can last from 2 hours to a week. There are more opportunitues with day trading, but that also means more opportunities for loss. You spend 1 hour a day making your watchlist, figure out your position sizing, and make alerts.
Hybrid Style In this lesson, you’ll learn what the MC Hybrid style of trading is and who it’s suitable for. This style of trading is the middle ground between day trading and swing trading (incorporating characteristics of both). It can be utilized as a part-time approach, but can also be used as a fulltime approach, alongside regular day trading. Hybrid style is when you check the higher timeframe and the lower timeframe also, they all confirm for example that the chart is bullish, so you execute on the 5 minute chart and then hold the position as a swing trade.
COMMIT TO A STYLE!
Don't get sucked into the long-term bias for example if you are a day trader.
9.Risk Management - Execution
Limit order/entry order
Limit order/entry order is when price pulls to that level, it will execute a trade. With a limit order you are entering blind, because the price may keep going against your favour. To minimize the risk, we look for a lot of confluence factors before placing a limit order.
Positive is that you get in with the best entry price, with the best position sizing. You don't have to be present during the day.
Market order/Live entry
Majority of the time you want to wait for confirmations. Wait for a rejection.
The 5 minute chart should give us a 50 EMA break, and that is when we place a live entry.
With a live entry you wait for pretty much every confluence factor you can get, and only then you place a trade.
1% Rule
You only risk 1% on all trades, if you are consistent and get good returns you can increase it to 2%, but only if you meet these 3 criterias:
1: You have at least a 5% return each month for at least 6 months, preferably 12 months.
2: All of your trades has at least a 2:1 reward:risk ratio.
3: You have a strike rate of at least 50%. Preferably 55-60%
Capital Partitioning
Capital partitioning means that if you have a $100k account that you are trading with a 1% risk, you could take 50% of that account, put it into a savings account and increase your risk to 2%, that way you are still technically risking only 1% of your total balance.
This way you are minimizing brokerage risk. if a broker goes bankrupt or if there is a flash crash where your stop loss doesn't hit you are not risking your entire account.
Another example would be, you put 30% into forex, 30% into equities and 30% into cryptocurrency account and then you risk 3% on each account.
Correlation Risk
You usually don't want to trade two pairs if they are correlated. for example two CAD pairs. You could be looking at 4 very good long GBP pairs, you could of course take all 4 trades but that means you are risking 4% on the GBP going up. Instead you should pick the best 2 or even your top 1 so you don't risk 4% on one pair.
Or you could be looking to short CAD with one pair and go long CAD with another pair, that is also correlation risk and you need to look into it further. Is CAD actually strong or weak?
Another example if you are looking into 5 tech companies, they all look promising to short, but taking every trade would mean you are risking 5% on the tech sector. Insetead find the best 2 and risk only 1-1%.
Sizing a Trade
Tradingview has a built-in position size calculator. You need to know 3 things:
1: 1% risk. How much are you risking per trade?
2: How are we entering this trade and where?
3: How far is your stop-loss?
10.Strategy #1 - IBO
Initial Breakout - Explanation
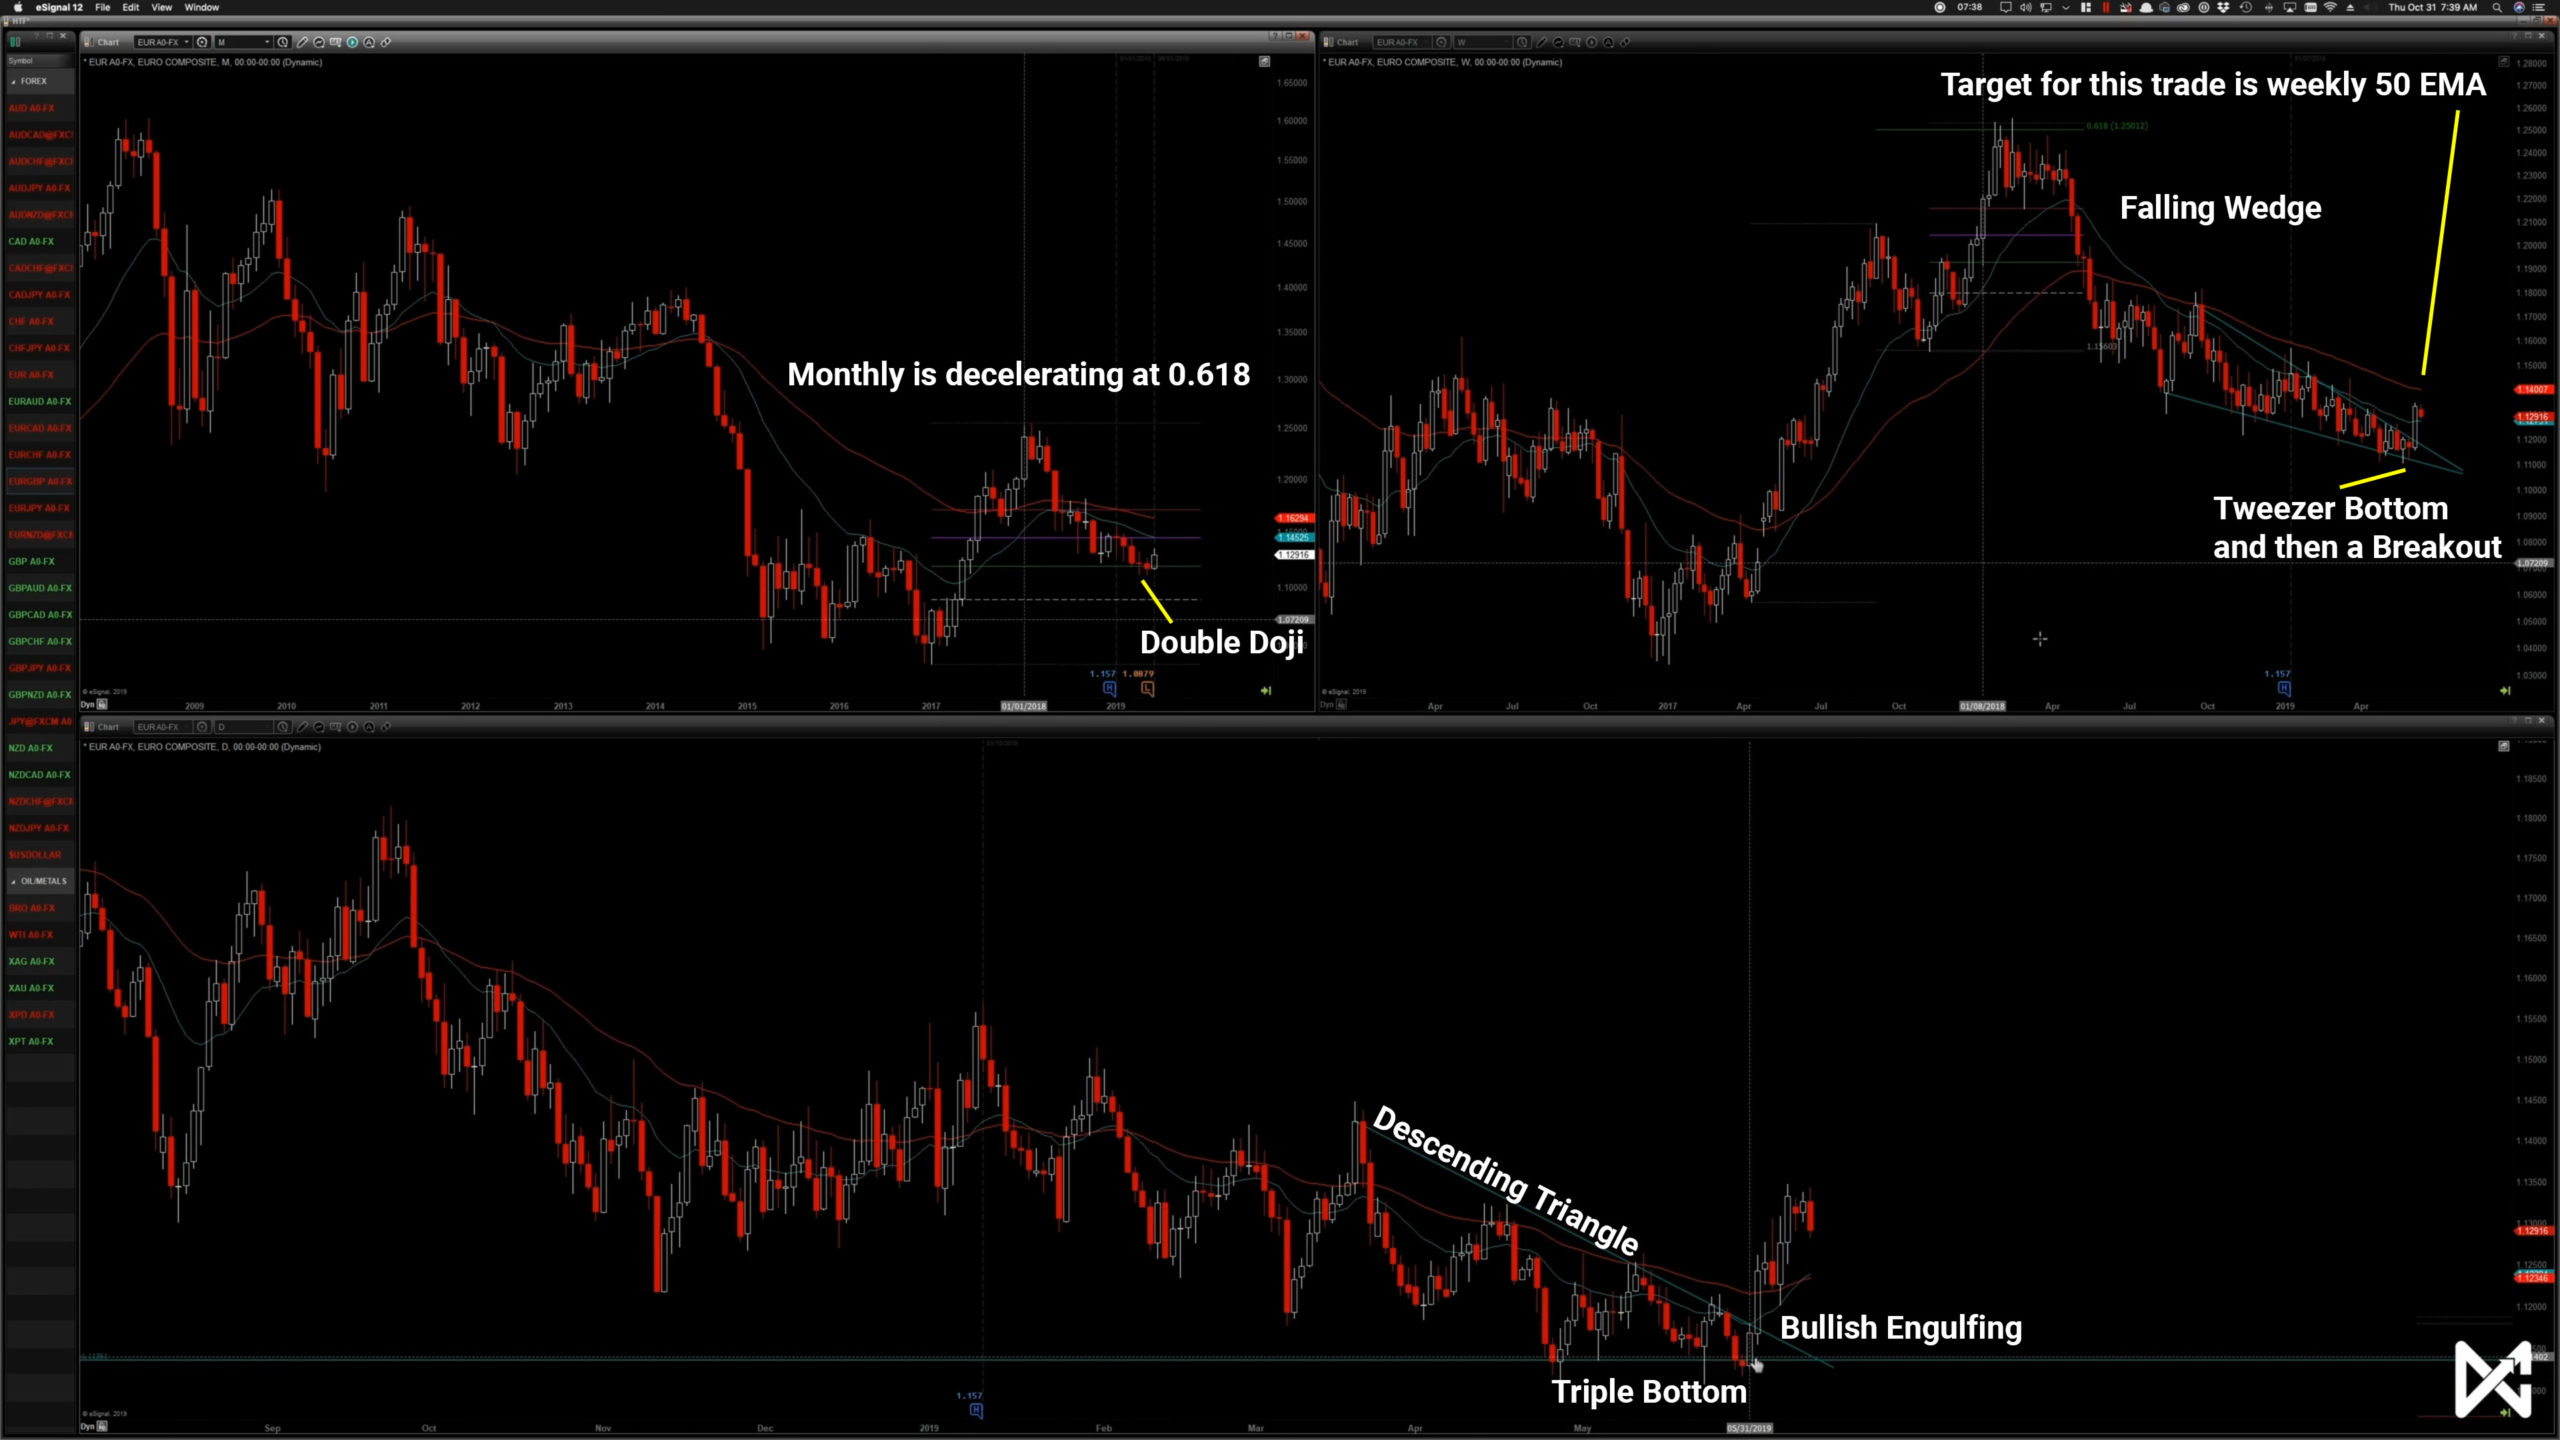
IBO is simple. On a higher timeframe we have some kind of a rejection of some kind of support/resistence level. And then on a lower timeframe, we have a break and retest of the 1 hour 50 EMA. With IBO we usually try to catch wave 3 on a lower timeframe.
We start off with Multi Time Frame Analysis on higher timeframe.
For example with the daily.
Do we have support/resistance?
Do we have deceleration/candle stick formation? (reversals)
Then we look at lower timeframe.
Do we have a break and retest of the 1 hour 50 EMA?
Do we have a trend change on lower timeframe?
A run on a higher timeframe is a trend on a lower timeframe.
On the 4 hour chart you just make sure that it is not against us.
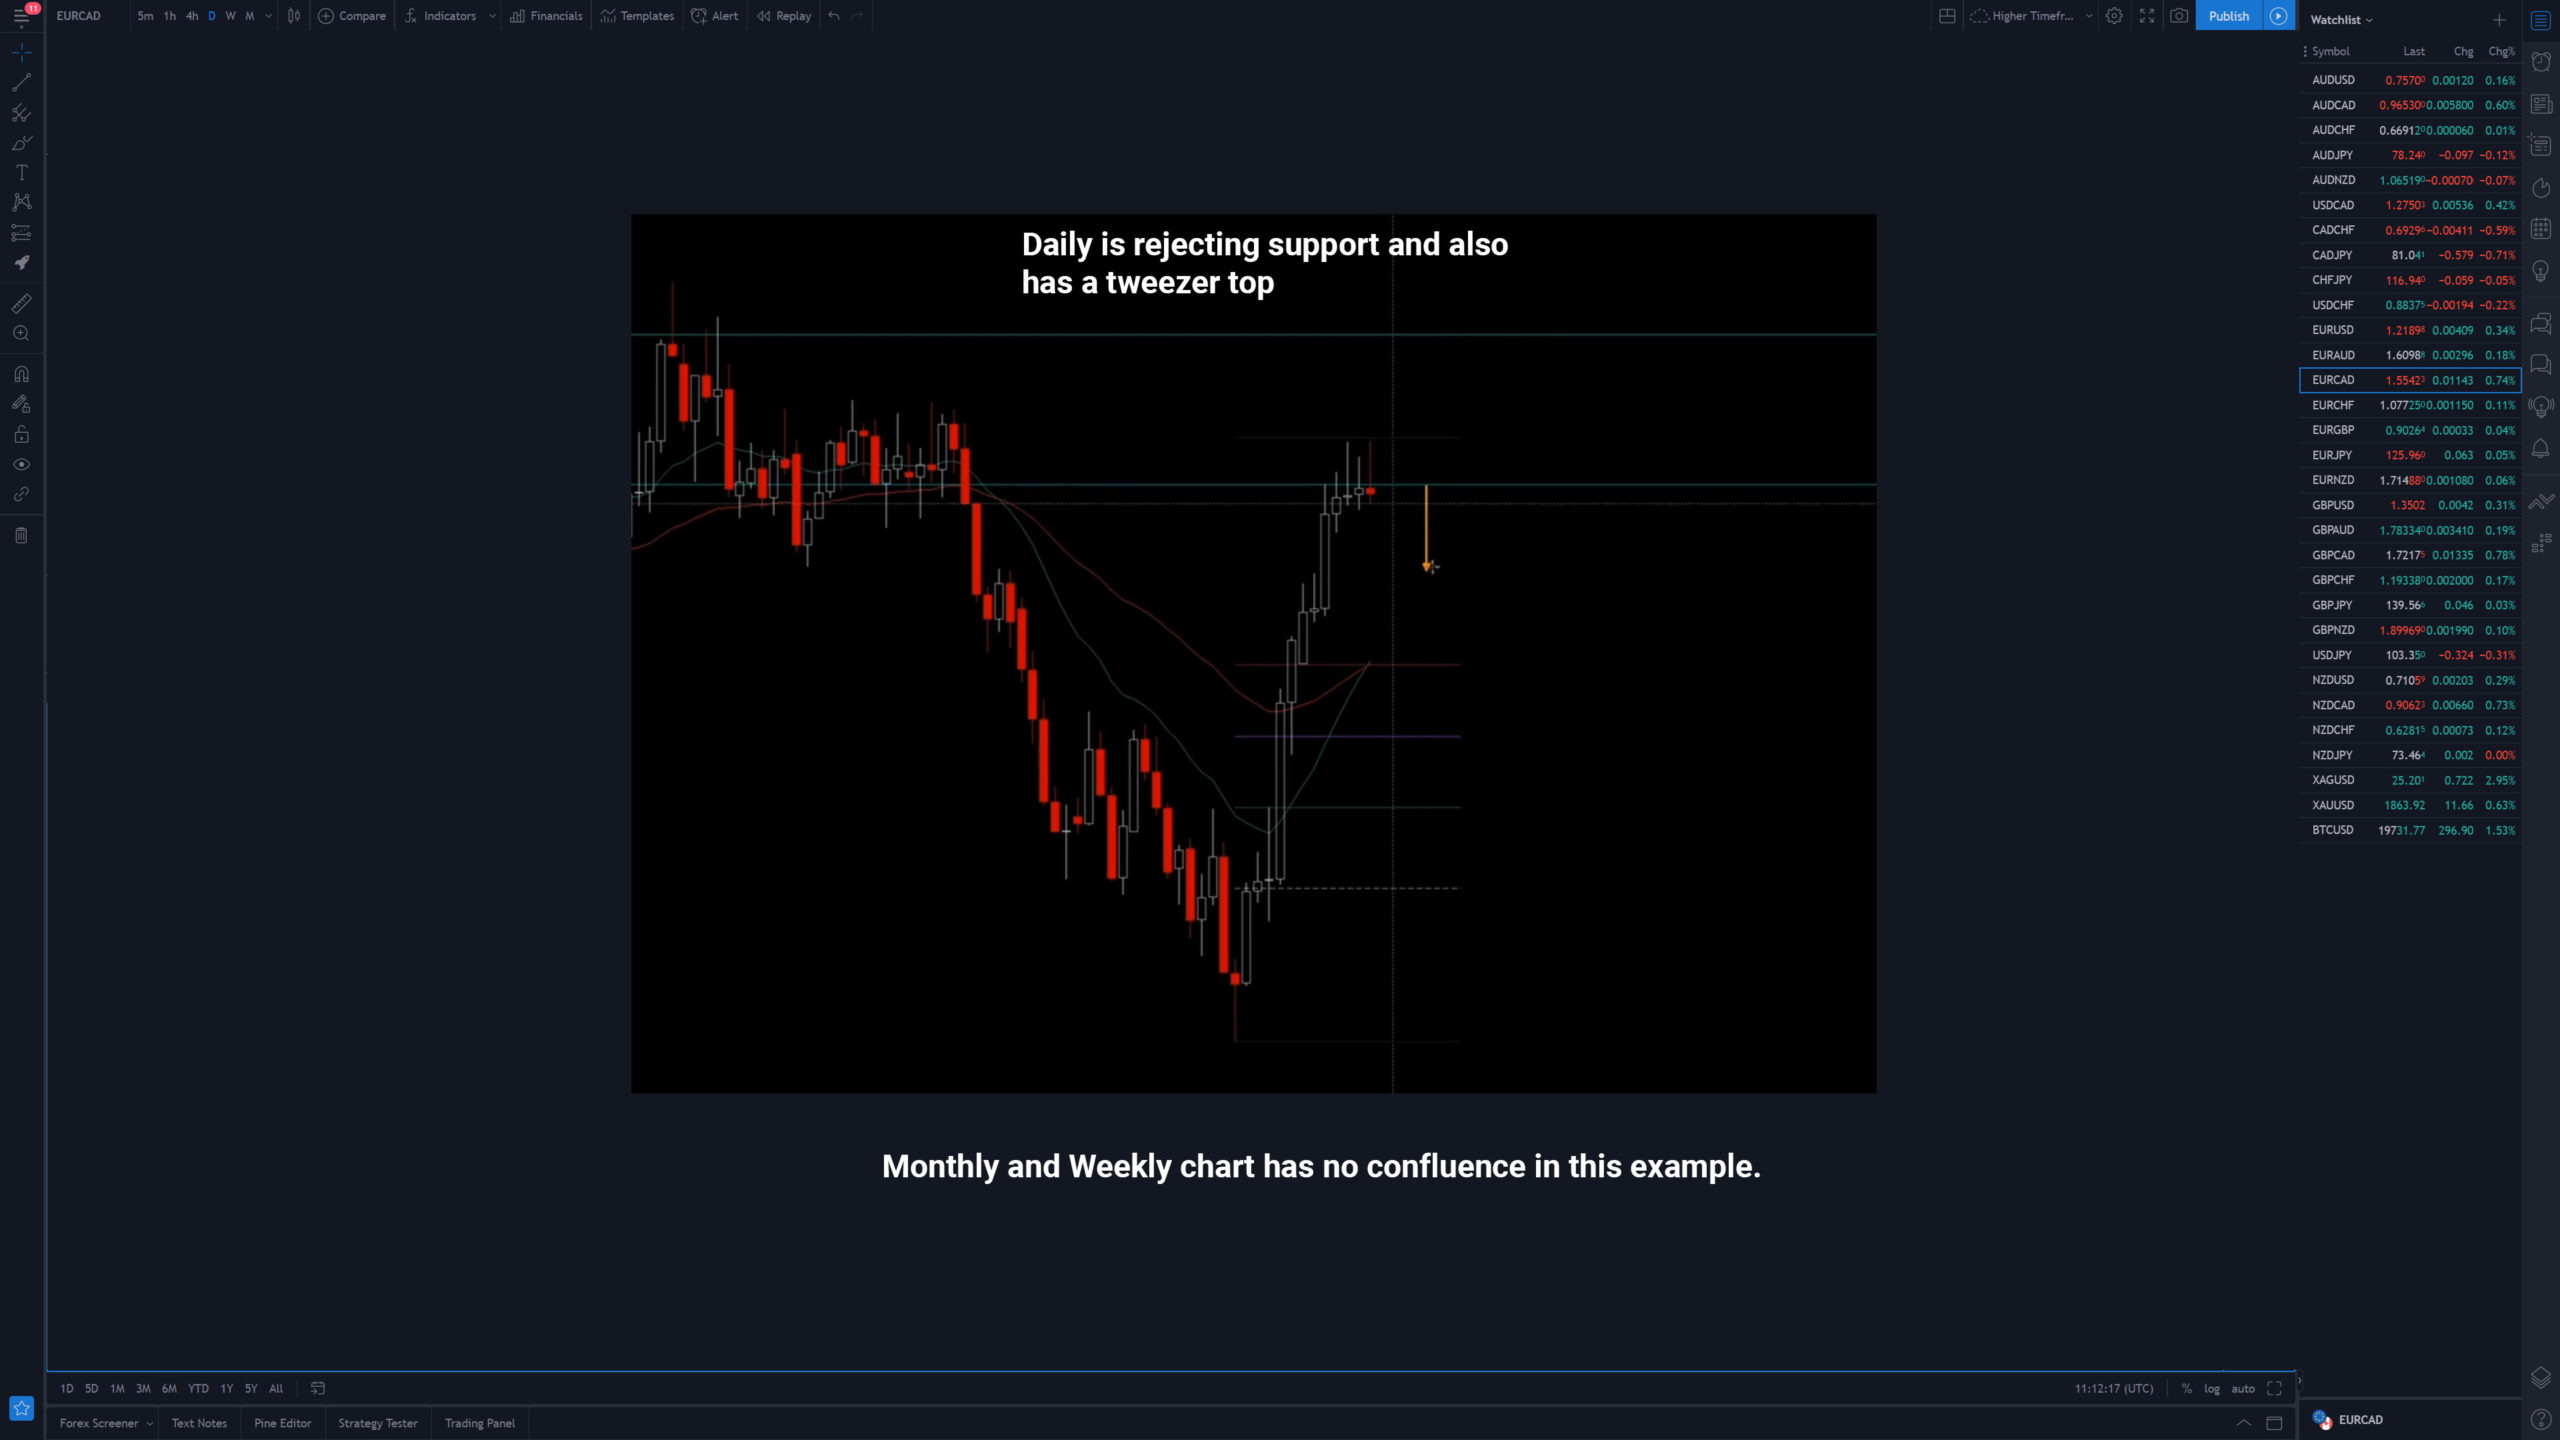
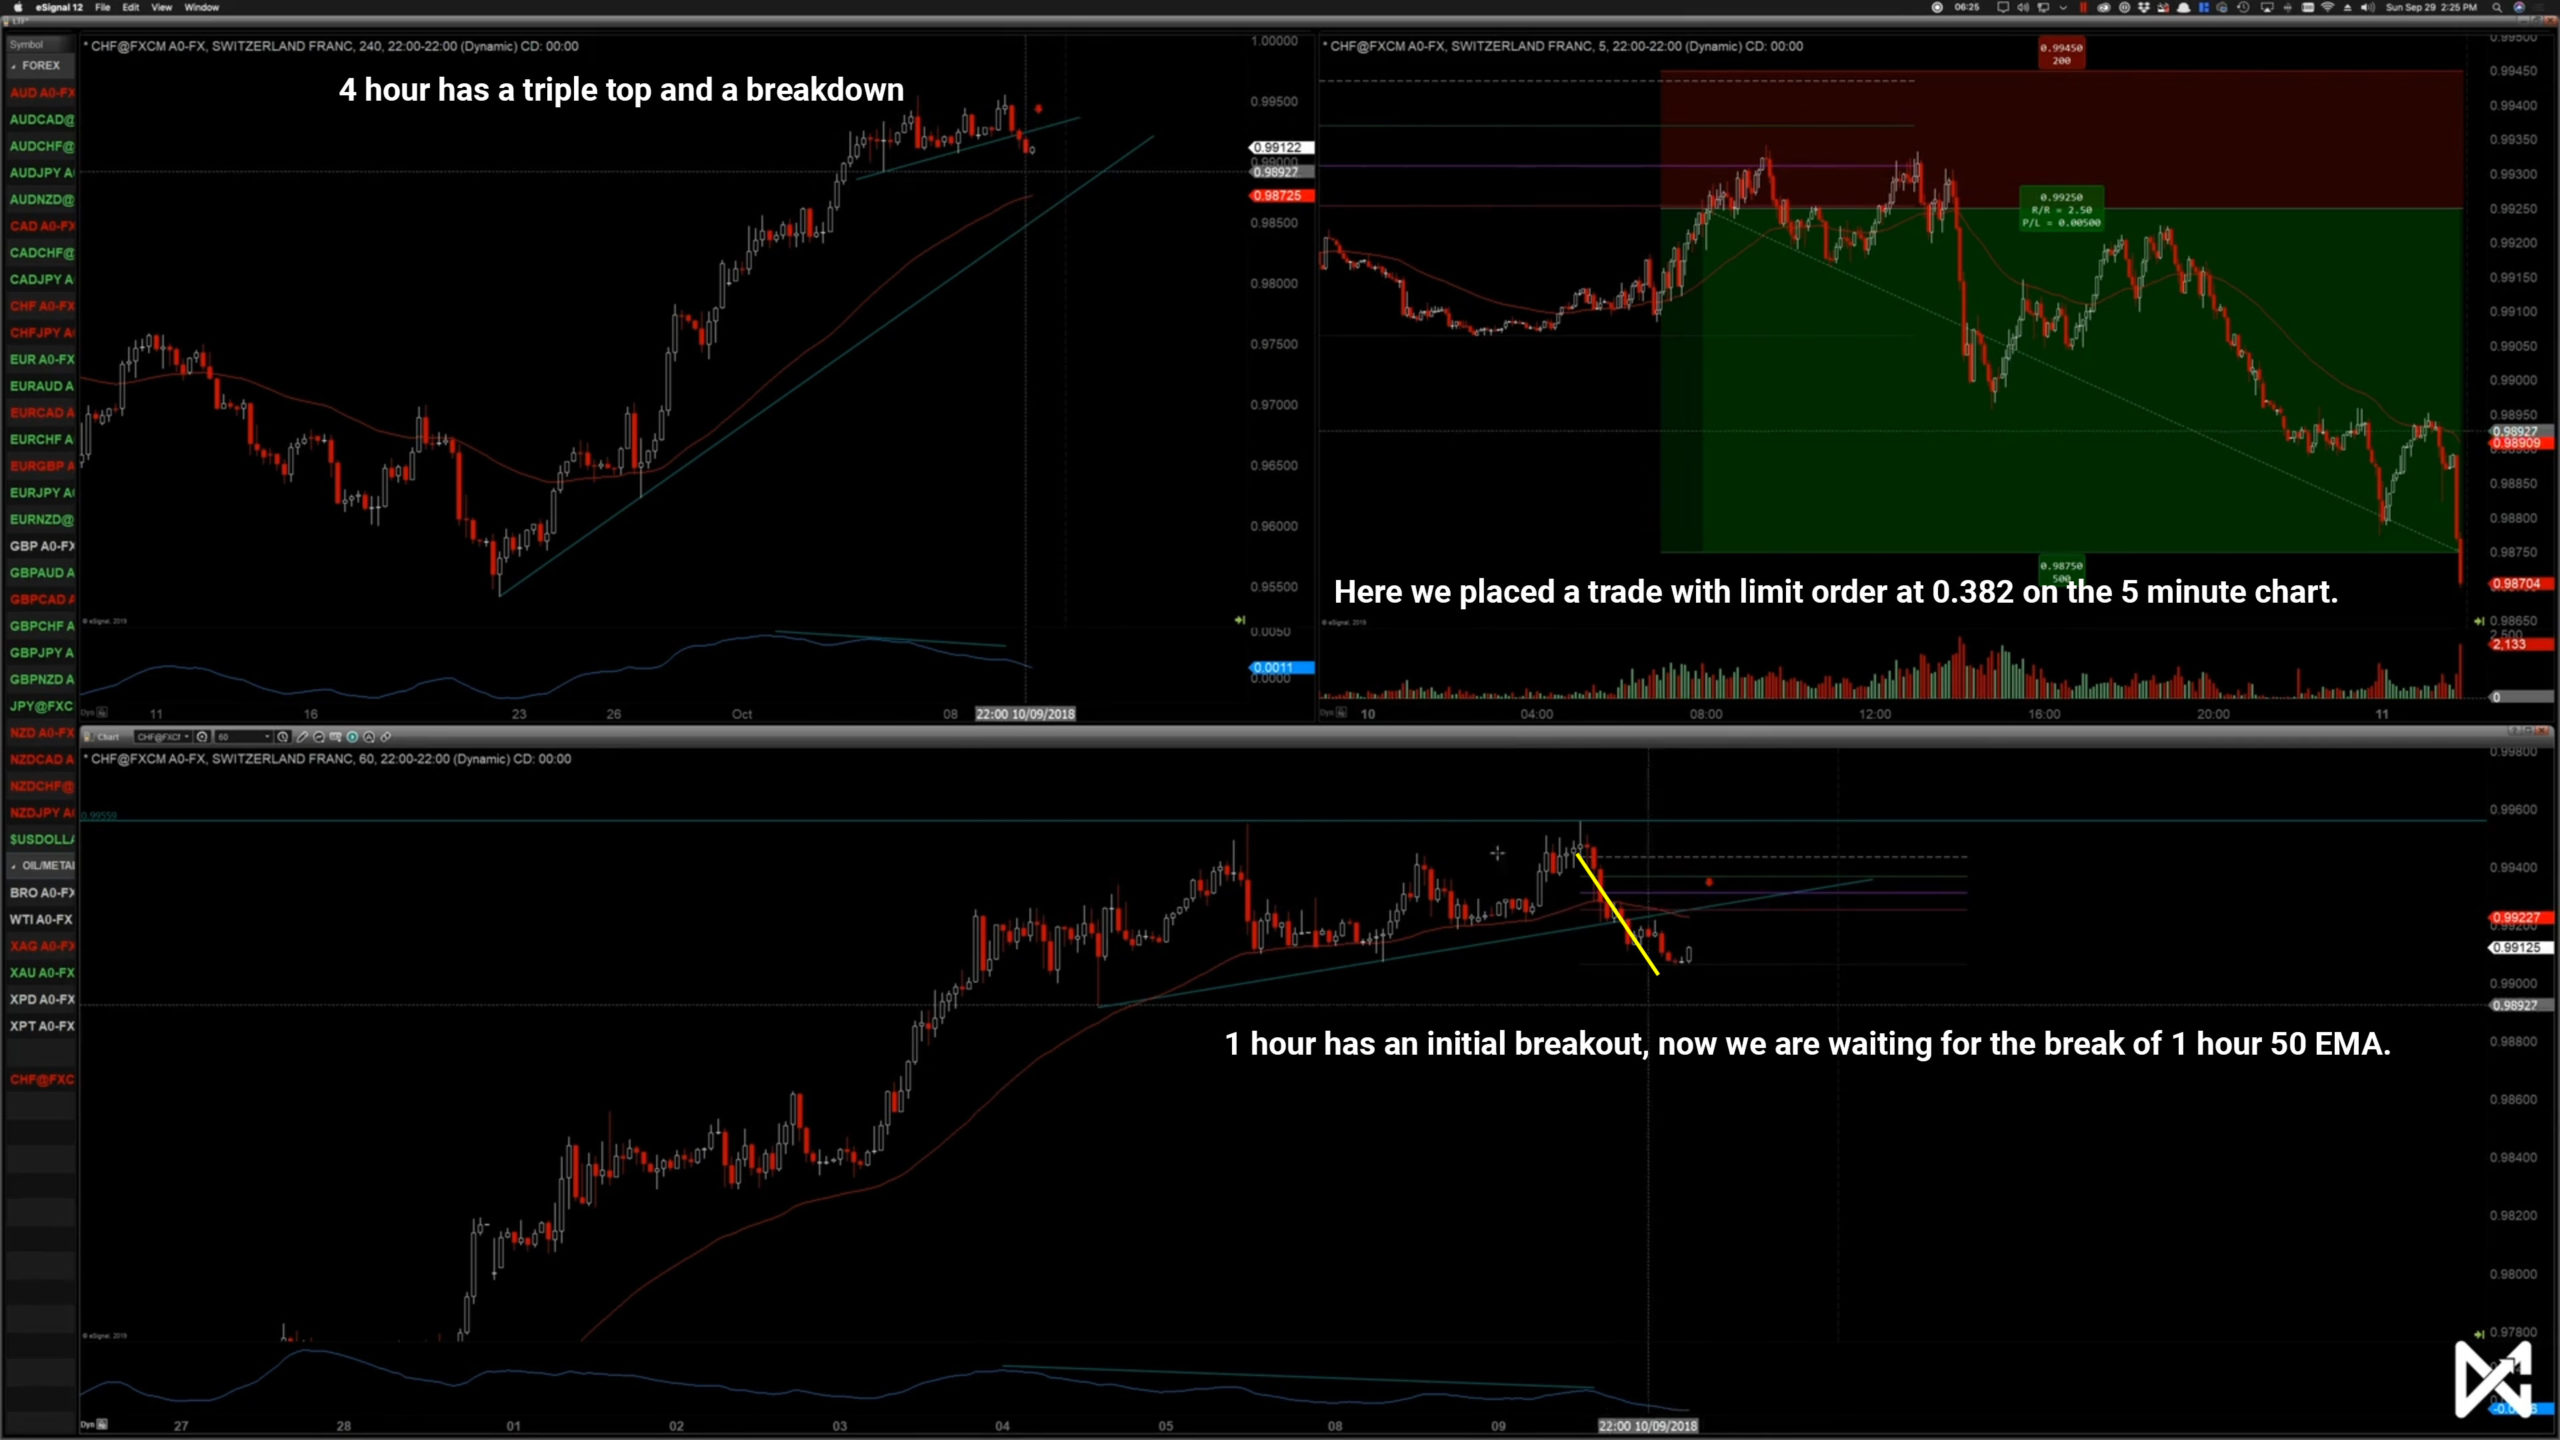
Initial Breakout - Execution
Here we don't have any higher timeframe confluence, only the daily chart is showing us a horizontal line rejection and has reversal candlestick formation.
Our stop-loss is always around 0.75 fibonacci on an IBO. Can be above or below a bit.
Safest take profit is the 4 hour 50 EMA.
You can enter either with a live entry or with a limit order.
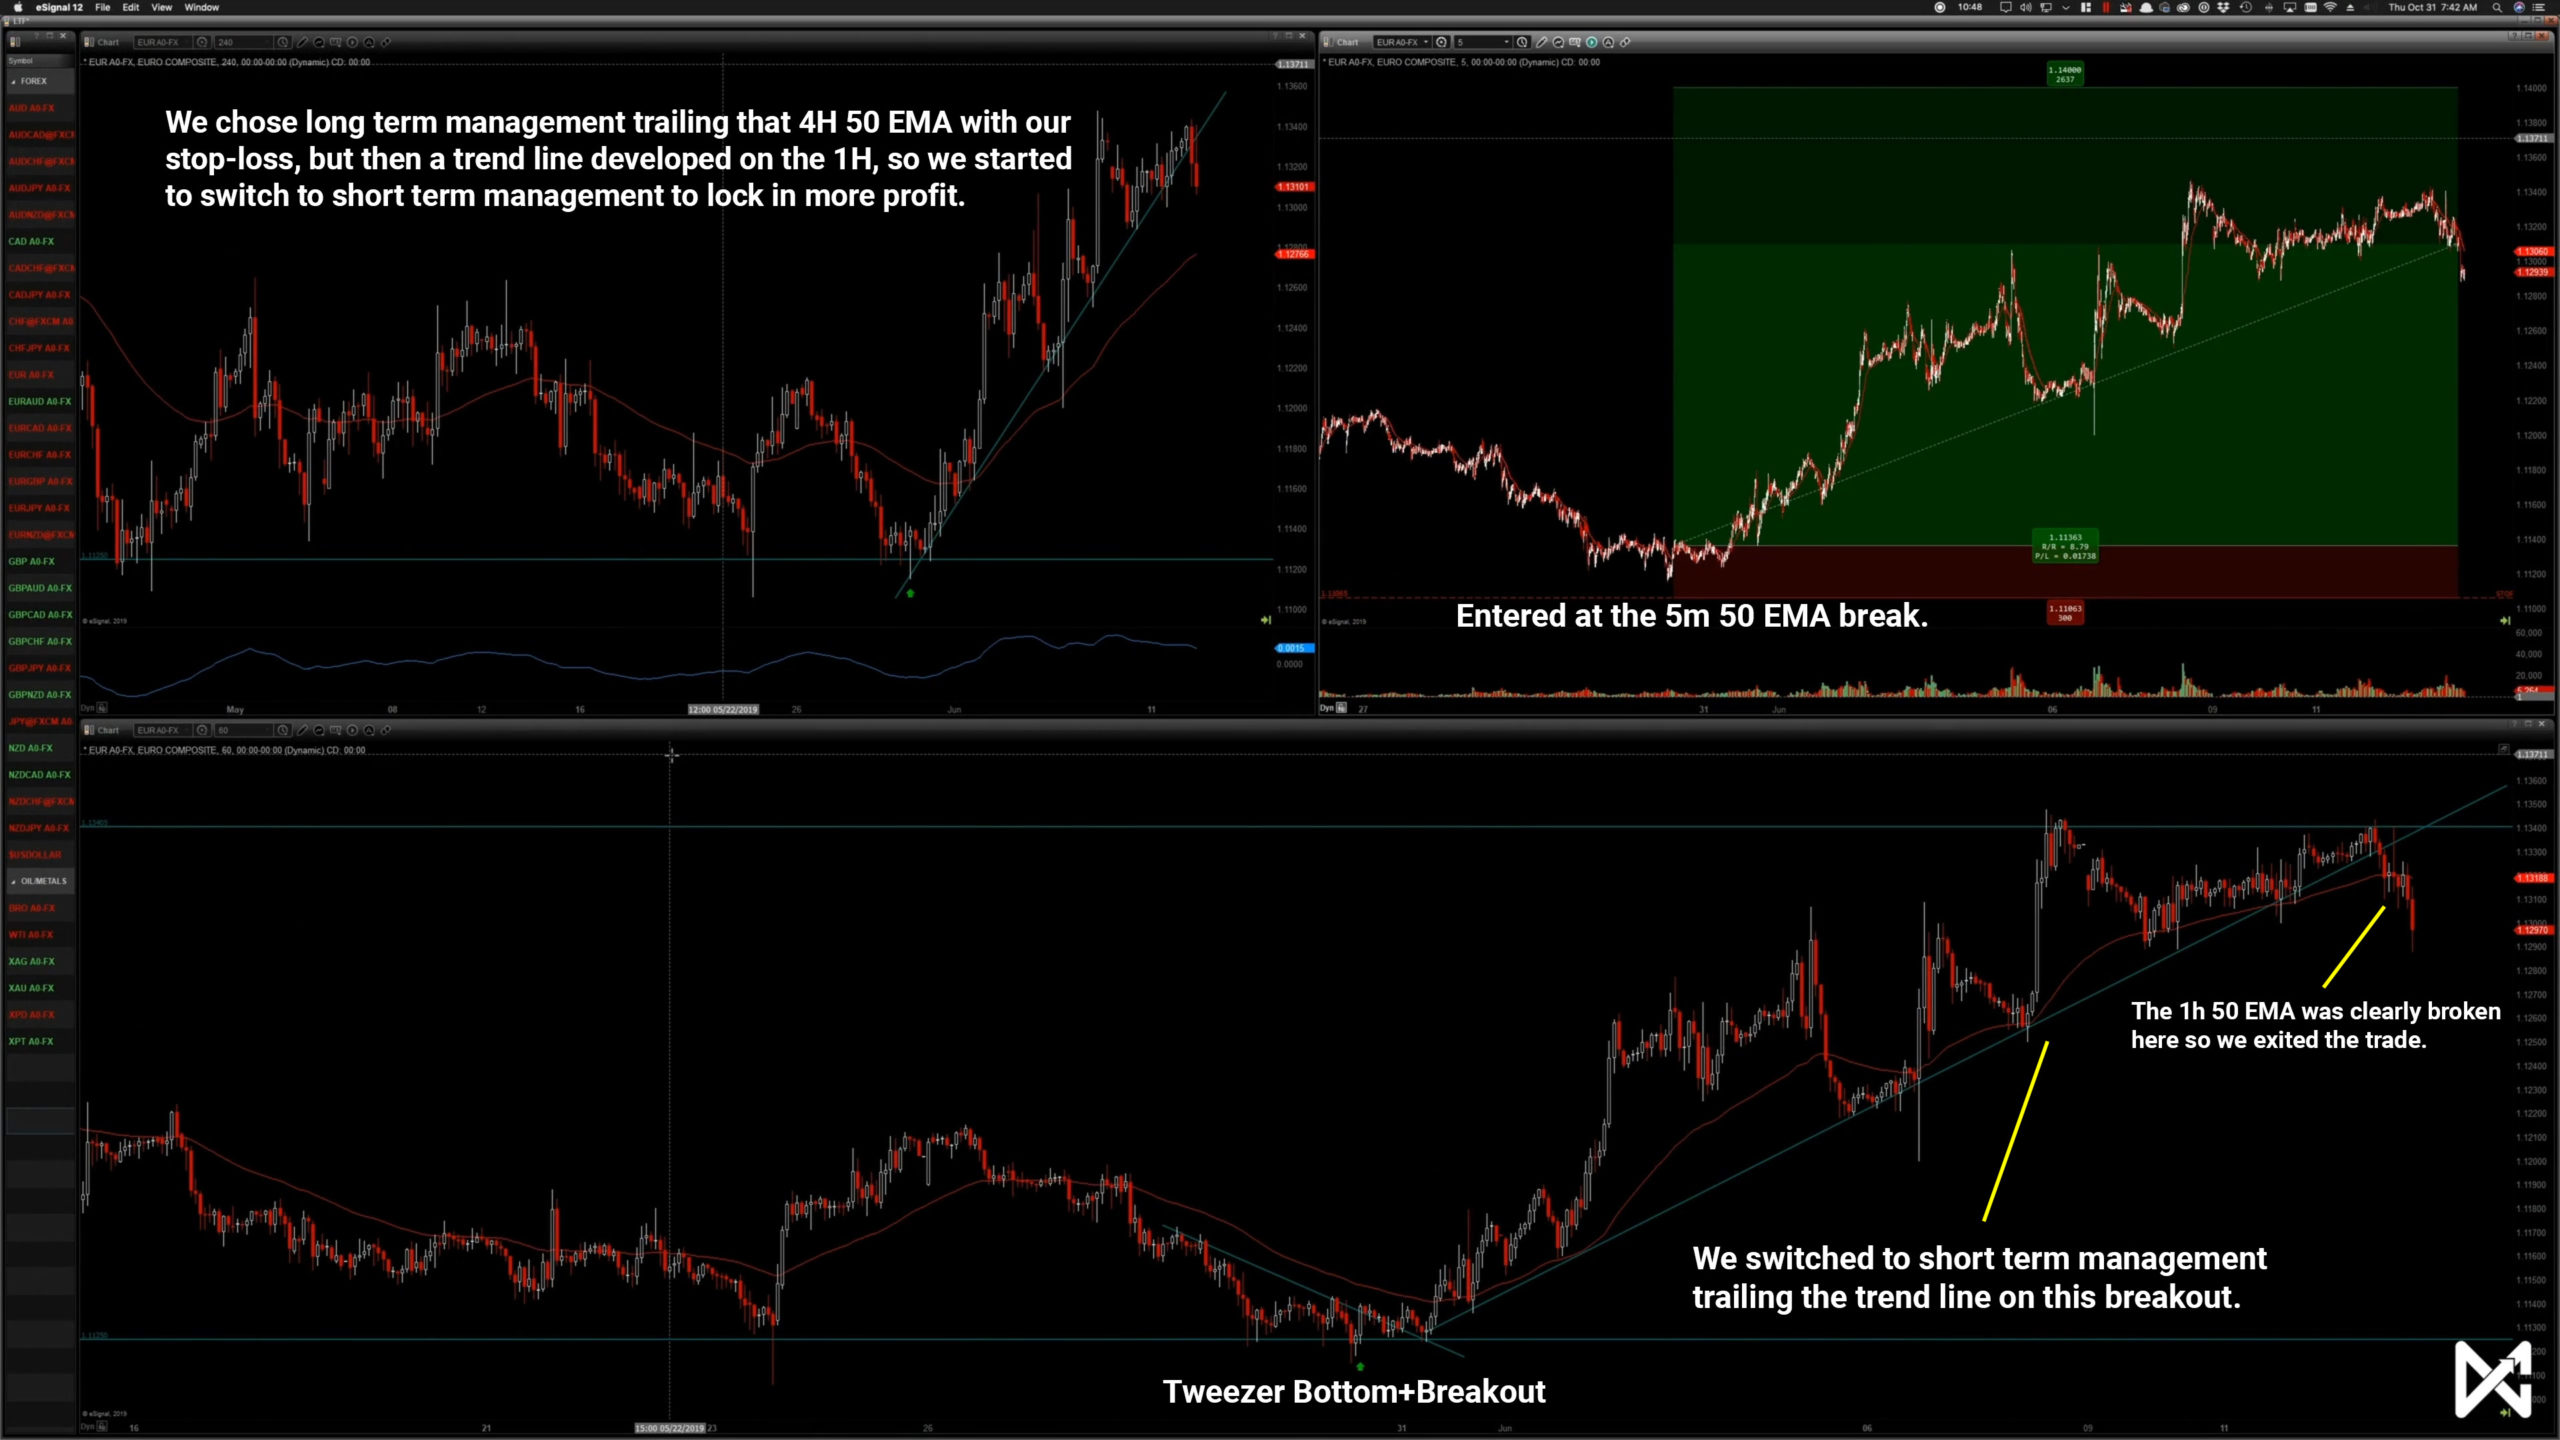
Entering live is safer, because we are waiting for a rejection of the 5 minute 50 EMA, once it breaks, that is when we enter the trade.
Entering with a limit order however gives us a better reward:risk ratio, but it could just keep going against us hitting our stop-loss, that is why waiting for confirmation and entering live is safer.
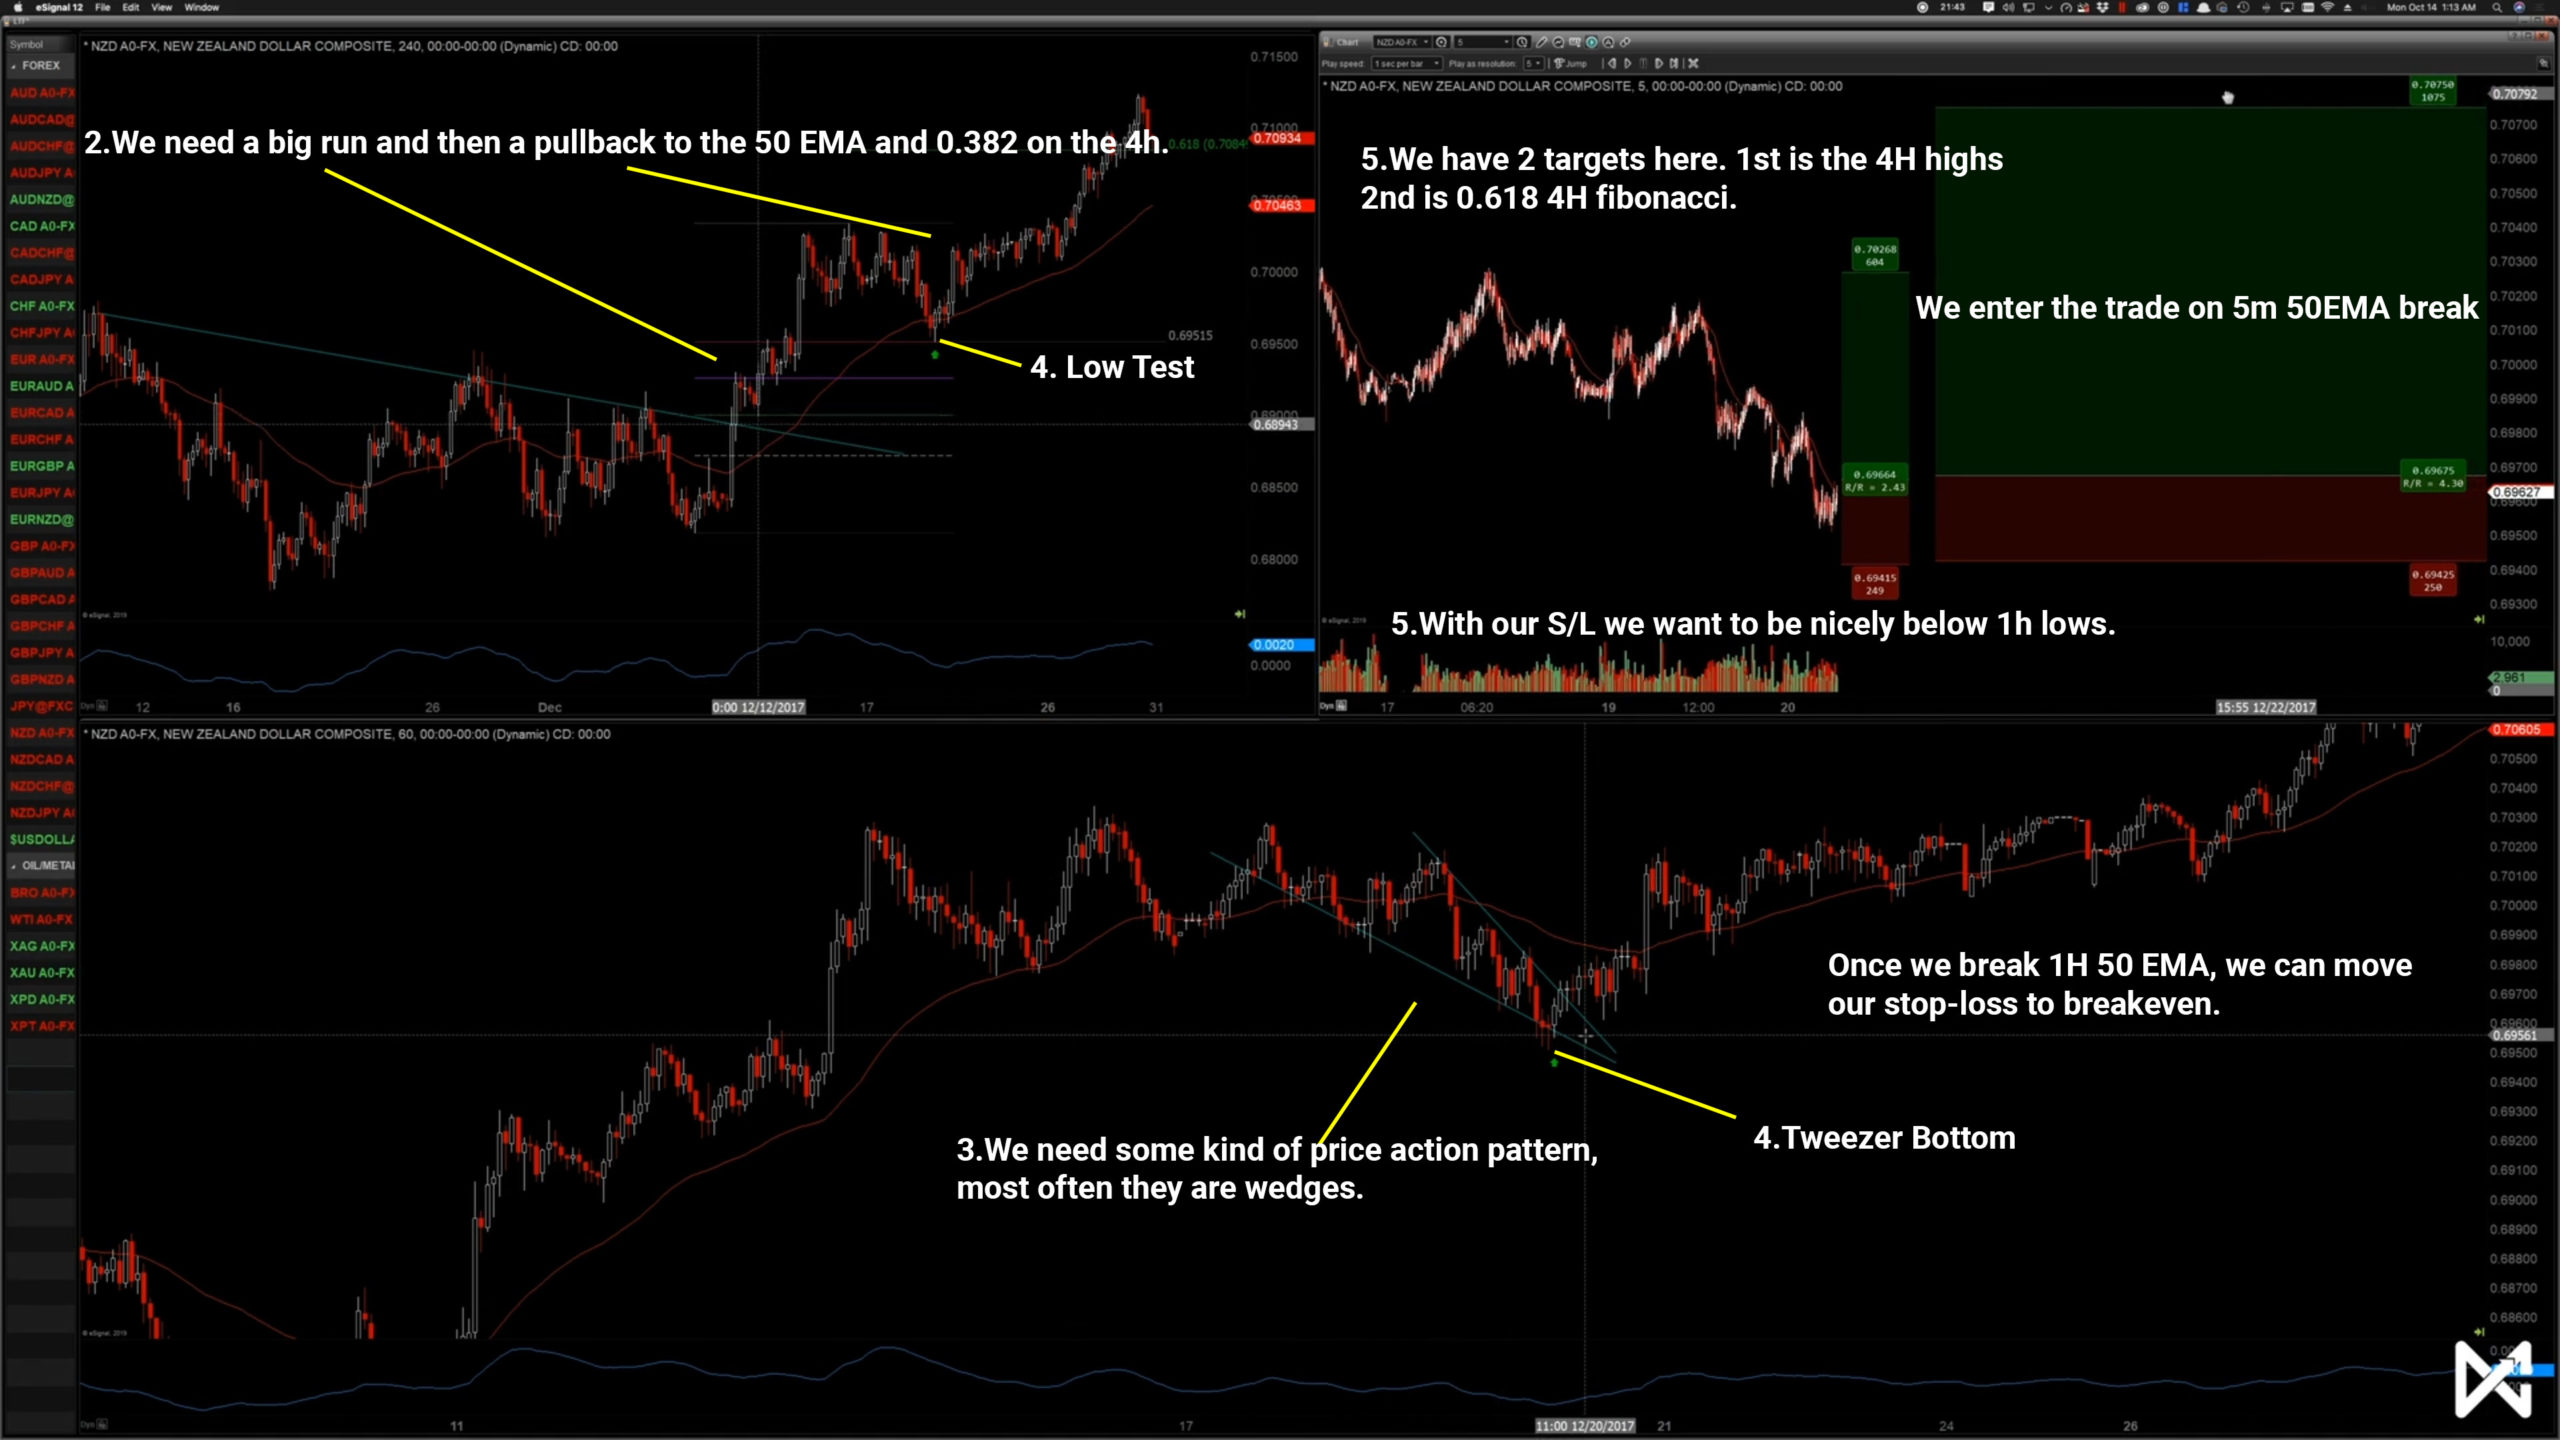
With a limit order we enter at 0.382 fibonacci.
Initial Breakout - ABC Variations
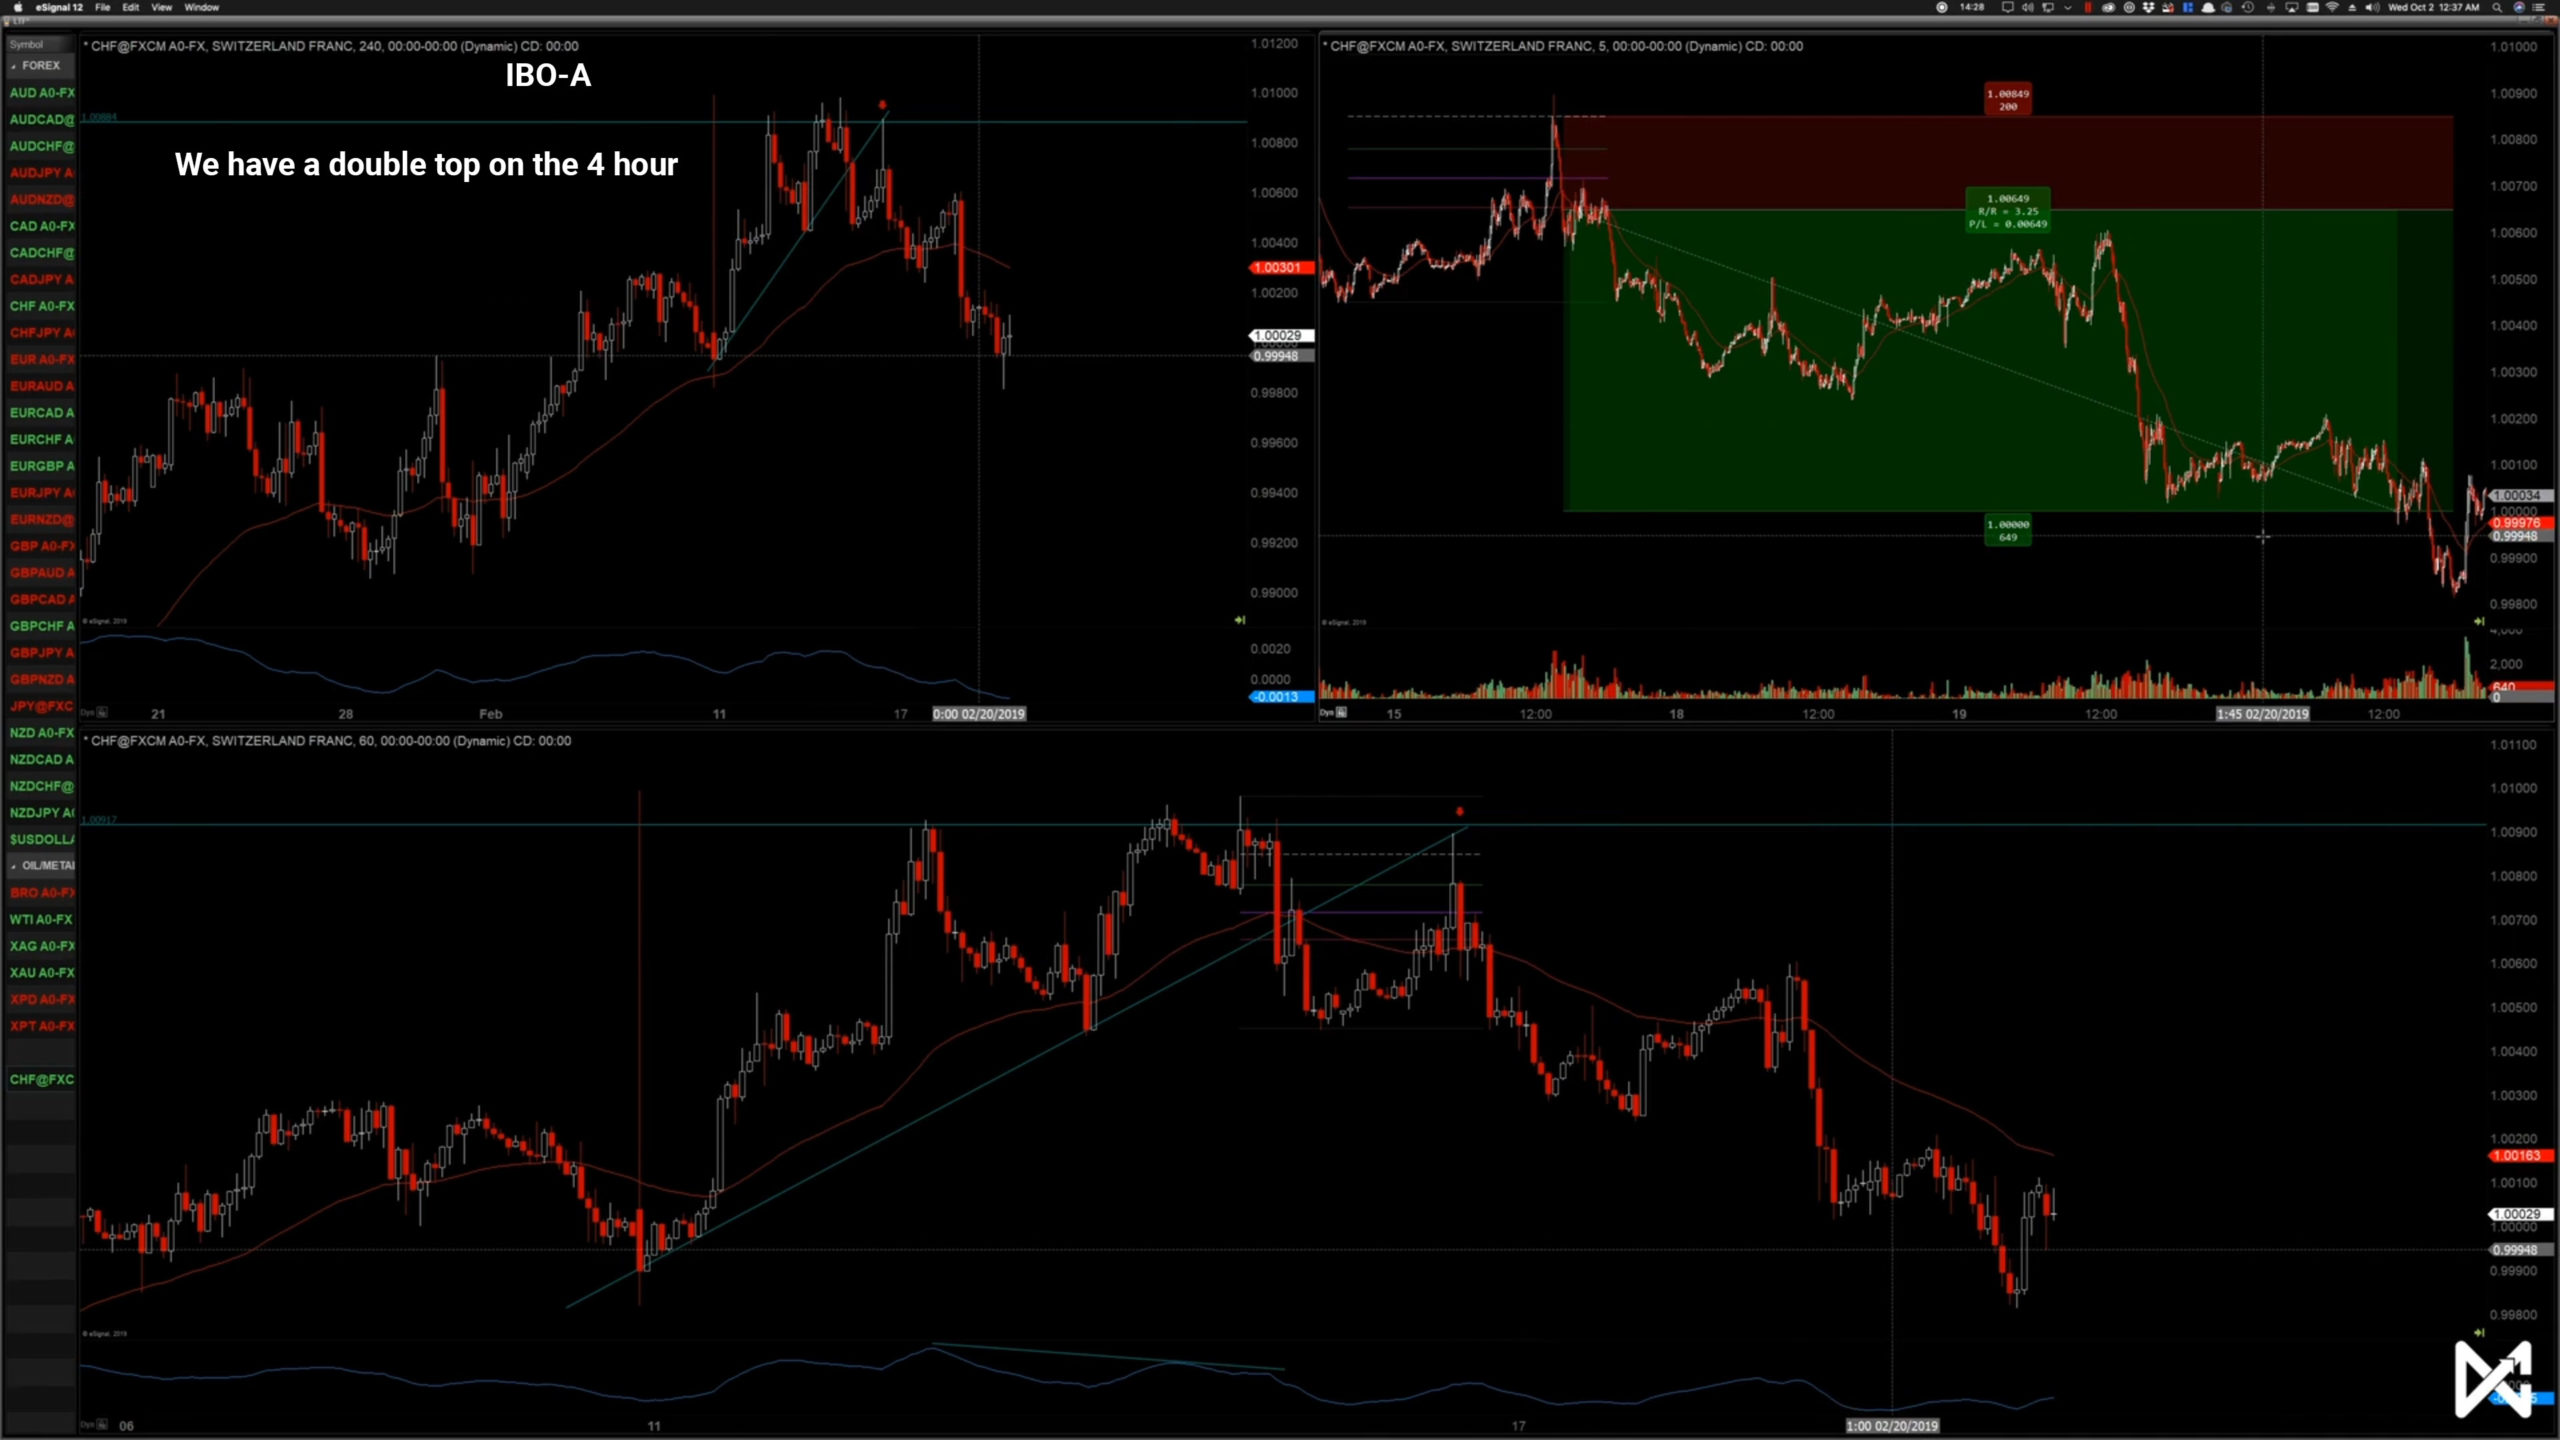
From best to worst: IBO-A: 4H already has a confirmation of a trend change.
IBO-B: 4H is developing a trend change while you are executing the trade.
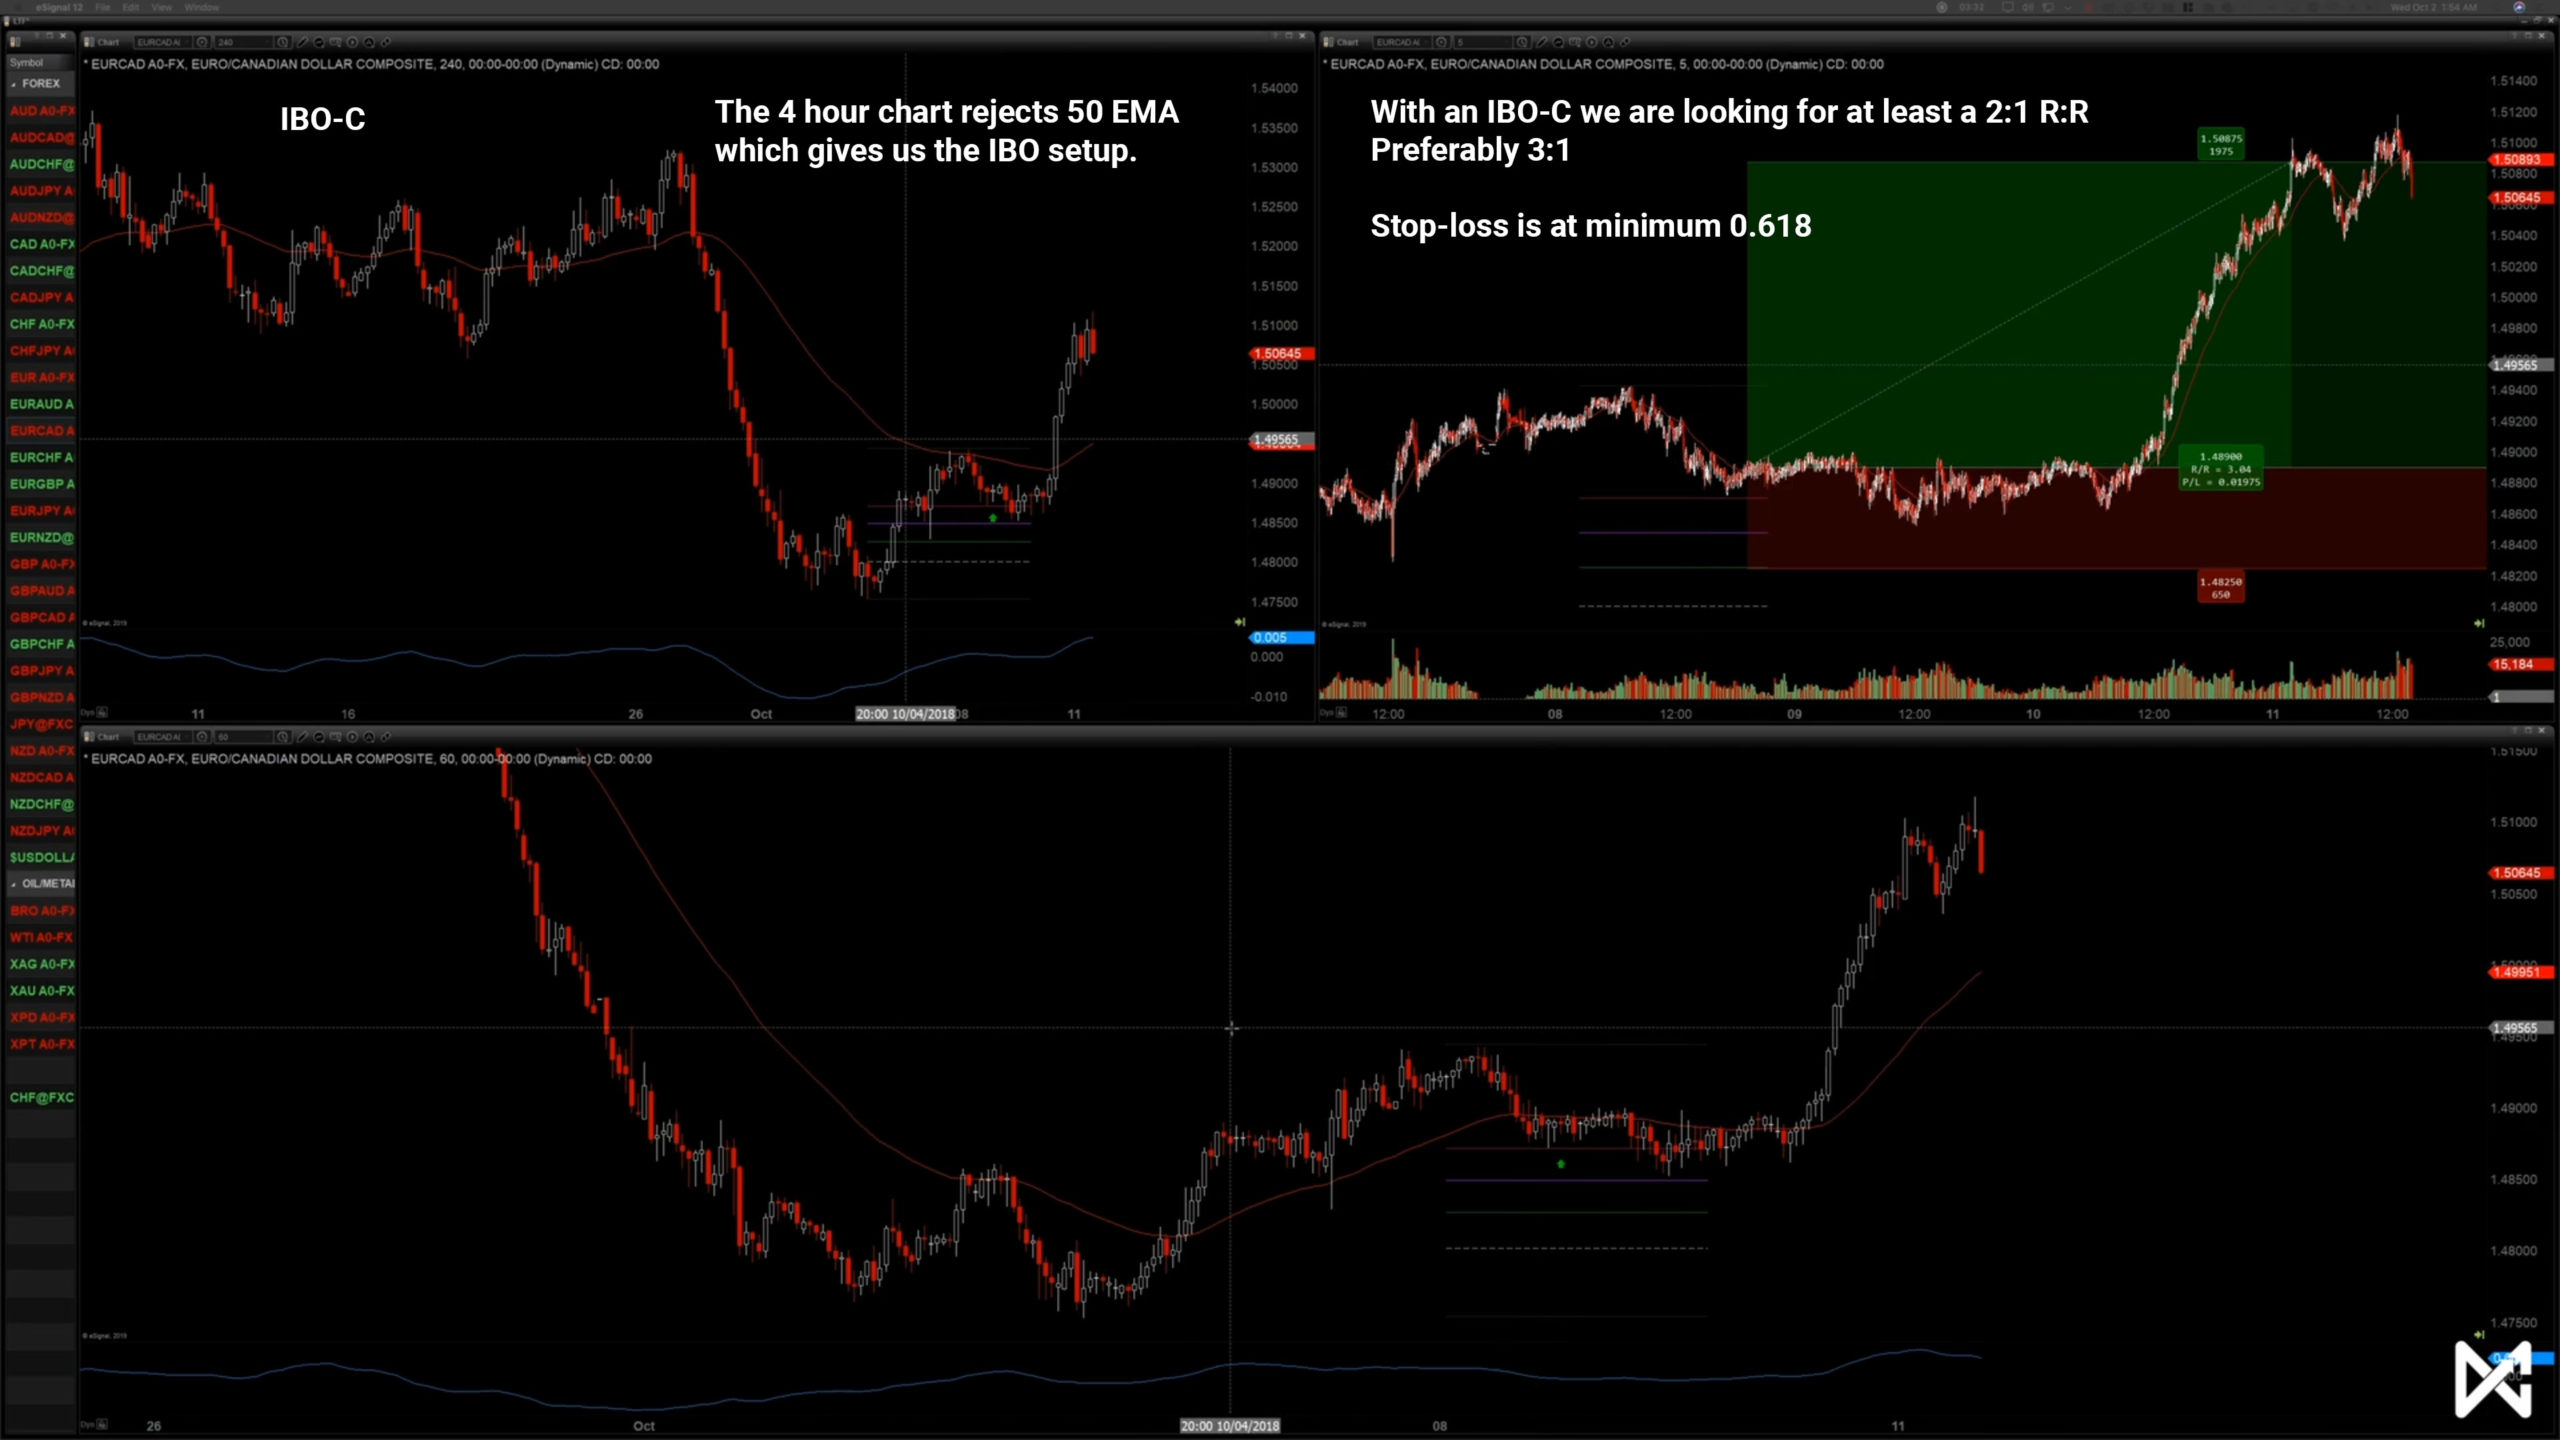
IBO-C: 4H has a 50EMA rejection before the trade is being executed
IBO-A
IBO-B
IBO-C
11.Strategy #2 - CBO
Complete Breakout - Explanation
The CBO is the safest strategies we have. It's a simple strategy maybe even simpler then IBO.
It has a full break of the 4 hour 50 EMA and the 1 hour 50 EMA.
It is one step further in development then the IBO. Still focusing at the beginning of the daily run/pullback. It typically happens within a 2-5 day window of that daily run/pullback.
Learn exactly what the Complete Breakout (CBO) is - similar to the IBO, but stacking even more confluence factors.
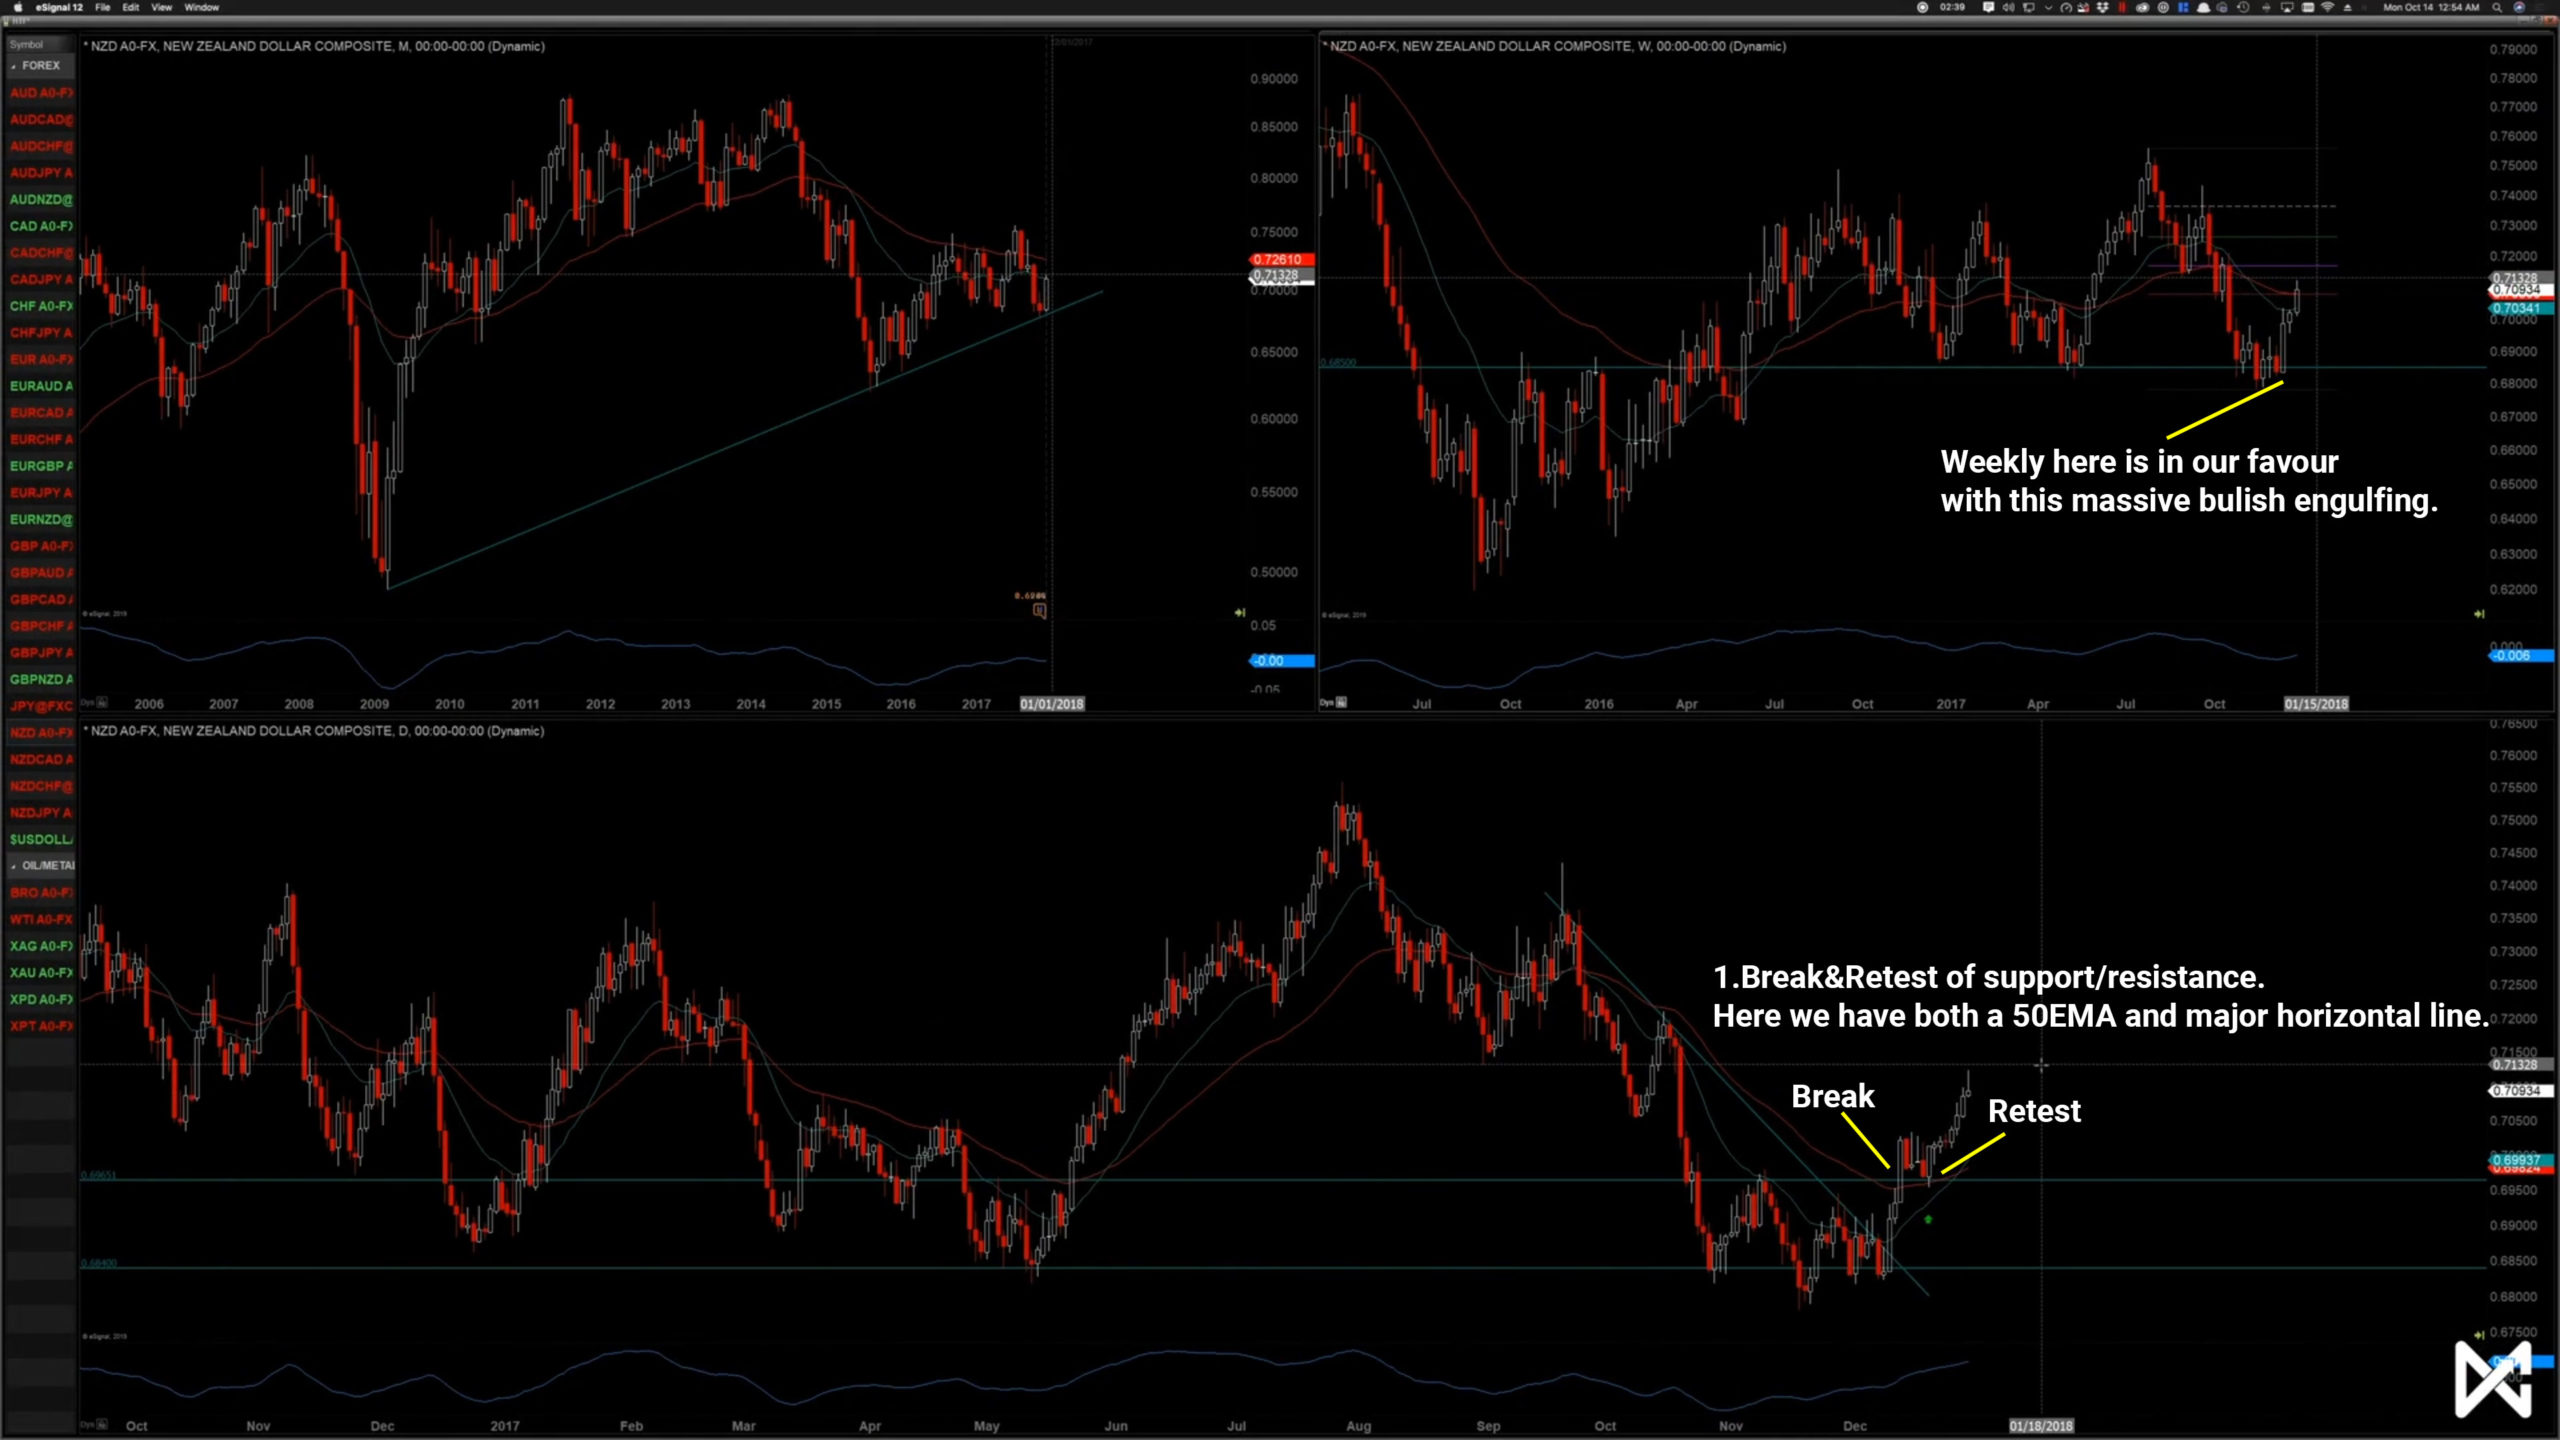
1: We need major support resistance on higher timeframe. (horizontal trend line, fibonacci retracement/extension, 50 EMA)
2: Is that level being rejected? We need candlestick formation to confirm.
3: Trend change, Initial break and retest of the 4h 50 EMA.
4: Initial break and retest of the 1h 50 EMA and 0.382 fibo.
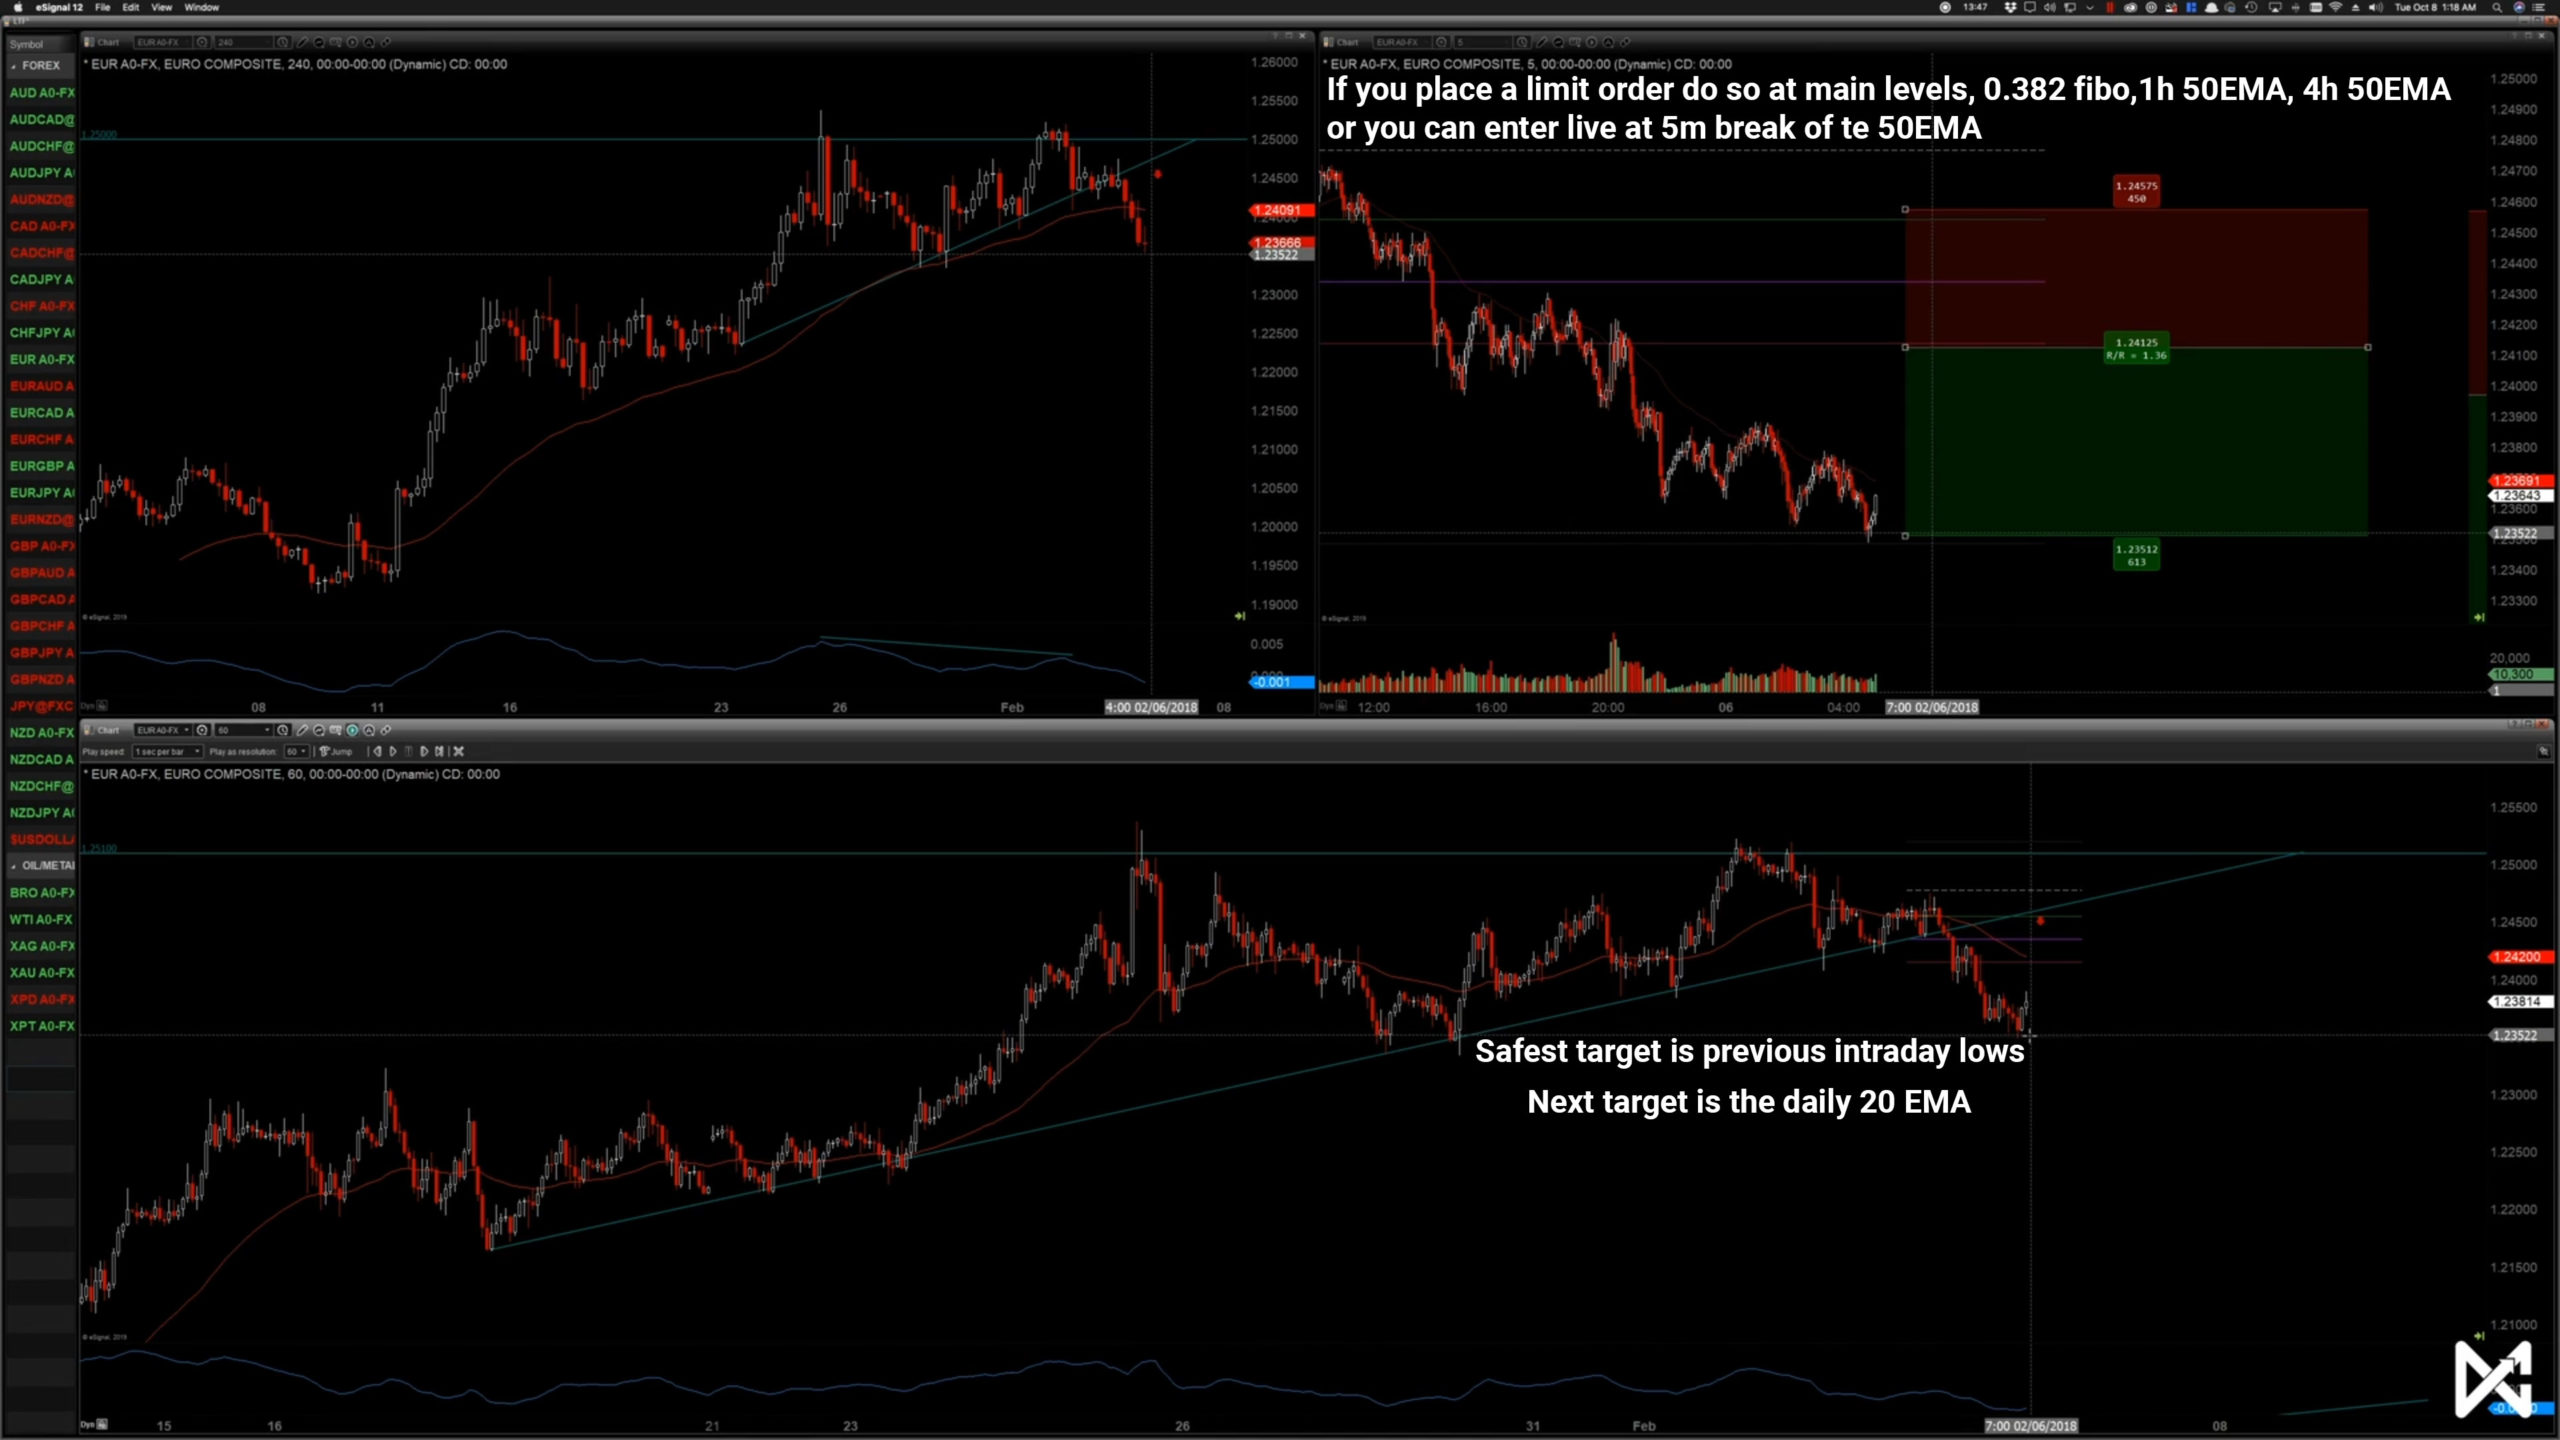
When we are trading with the trend, that's when we can push targets. When we are trading with a pullback, we are trading against the trend, so we need to be quicker with our management/targets.
Targets for pullback:
1: The safest target is the previous intraday (1h) lows.
2: Daily 20 EMA.
3: On a pullback the furthest to push a trade is 0.382 fibonacci retracement.
Complete Breakout - Execution
12.Strategy #3 - ABO
Advanced Breakout - Explanation
This strategy is more advanced and can require more patience.
An ABO happens before IBO and CBO. We are catching the beginning of the higher timeframe run/pullback, and the very beginning of a lower timeframe trend.
With an ABO we try to catch wave 1 of the elliot wave. An ABO is more complex and more aggressive.
There are a lot of good confluence factors which we use to minimize risk, because the reward is really good, we are targeting at least 2:1 or 3:1 or even higher reward:risk ratio.
ABO is typically a quick in and out day trade which happens within a few hours.
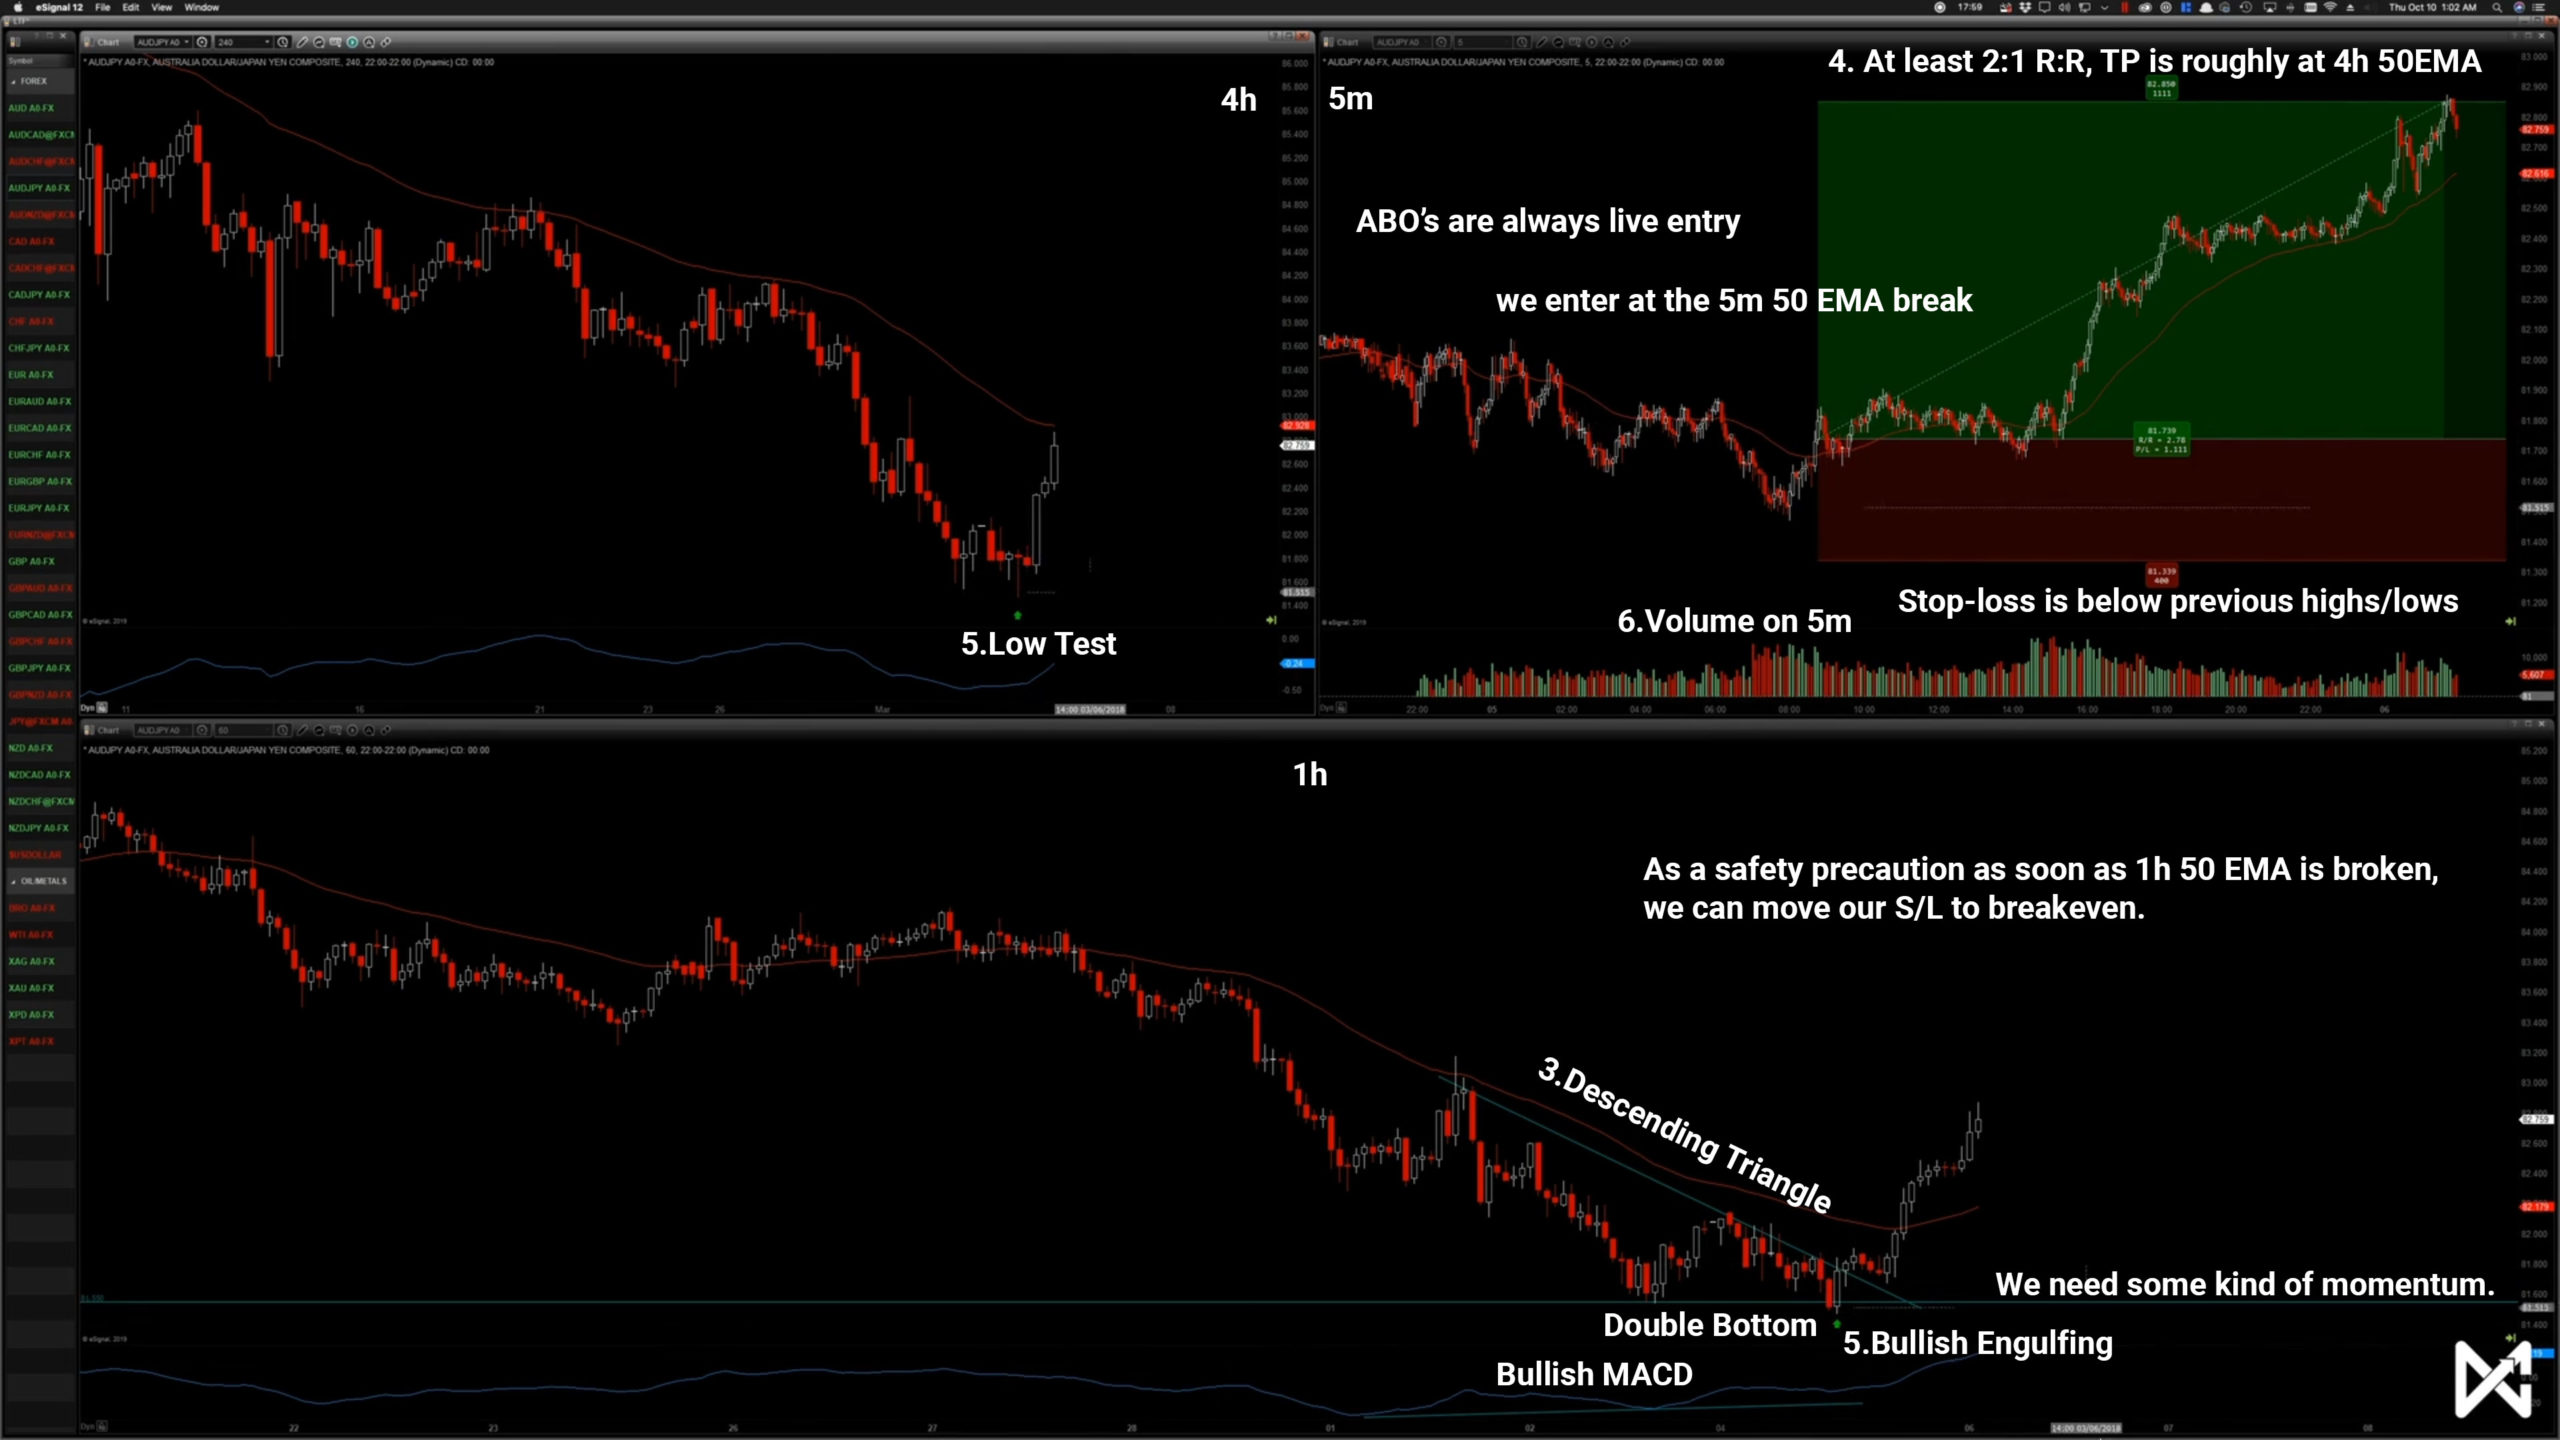
Criterias:
1: We have some kind of major support/resistance on higher timeframes.
2: We need some kind of deceleration on the higher timeframes at that major line. We don't need a candlestick formation, it's great if we have, but not neccesary.
3: On the lower timeframe, such as the 1 hour, we have some kind of price action pattern and the trend has finished. So wave 5 is finished and we get a descending triangle, ascending triangle, wedge, double bottom, etc.
4: We have at least 2:1 R:R on the 4 hour timeframes. Up to the 4 hour 50 EMA. The main target is typically the 4h 50 EMA.
5: 1h and 4h chart has some kind of reversal candlestick.
6: Volume on the 5minute chart when the breakout is happening.
If you miss an ABO, it's okay, because the next strategy comes right after it, the IBO. If you are not comfortable with an ABO first master IBO and CBO and then you can move on to it.
Advanced Breakout - Execution
13.Strategy #4 - ACB
Advanced Continuation Breakout - Explanation
Learn exactly what the Advanced Continuation Breakout (ACB) is. This is another more advanced strategy, and it can help you to identify traps in the market (i.e. capital preservation).
The ACB typically happens after the CBO. So it happens typically after a wave 4 pullback and we are catching a wave 5 run.
An ACB can happen between 5-10 candles.
Criterias:
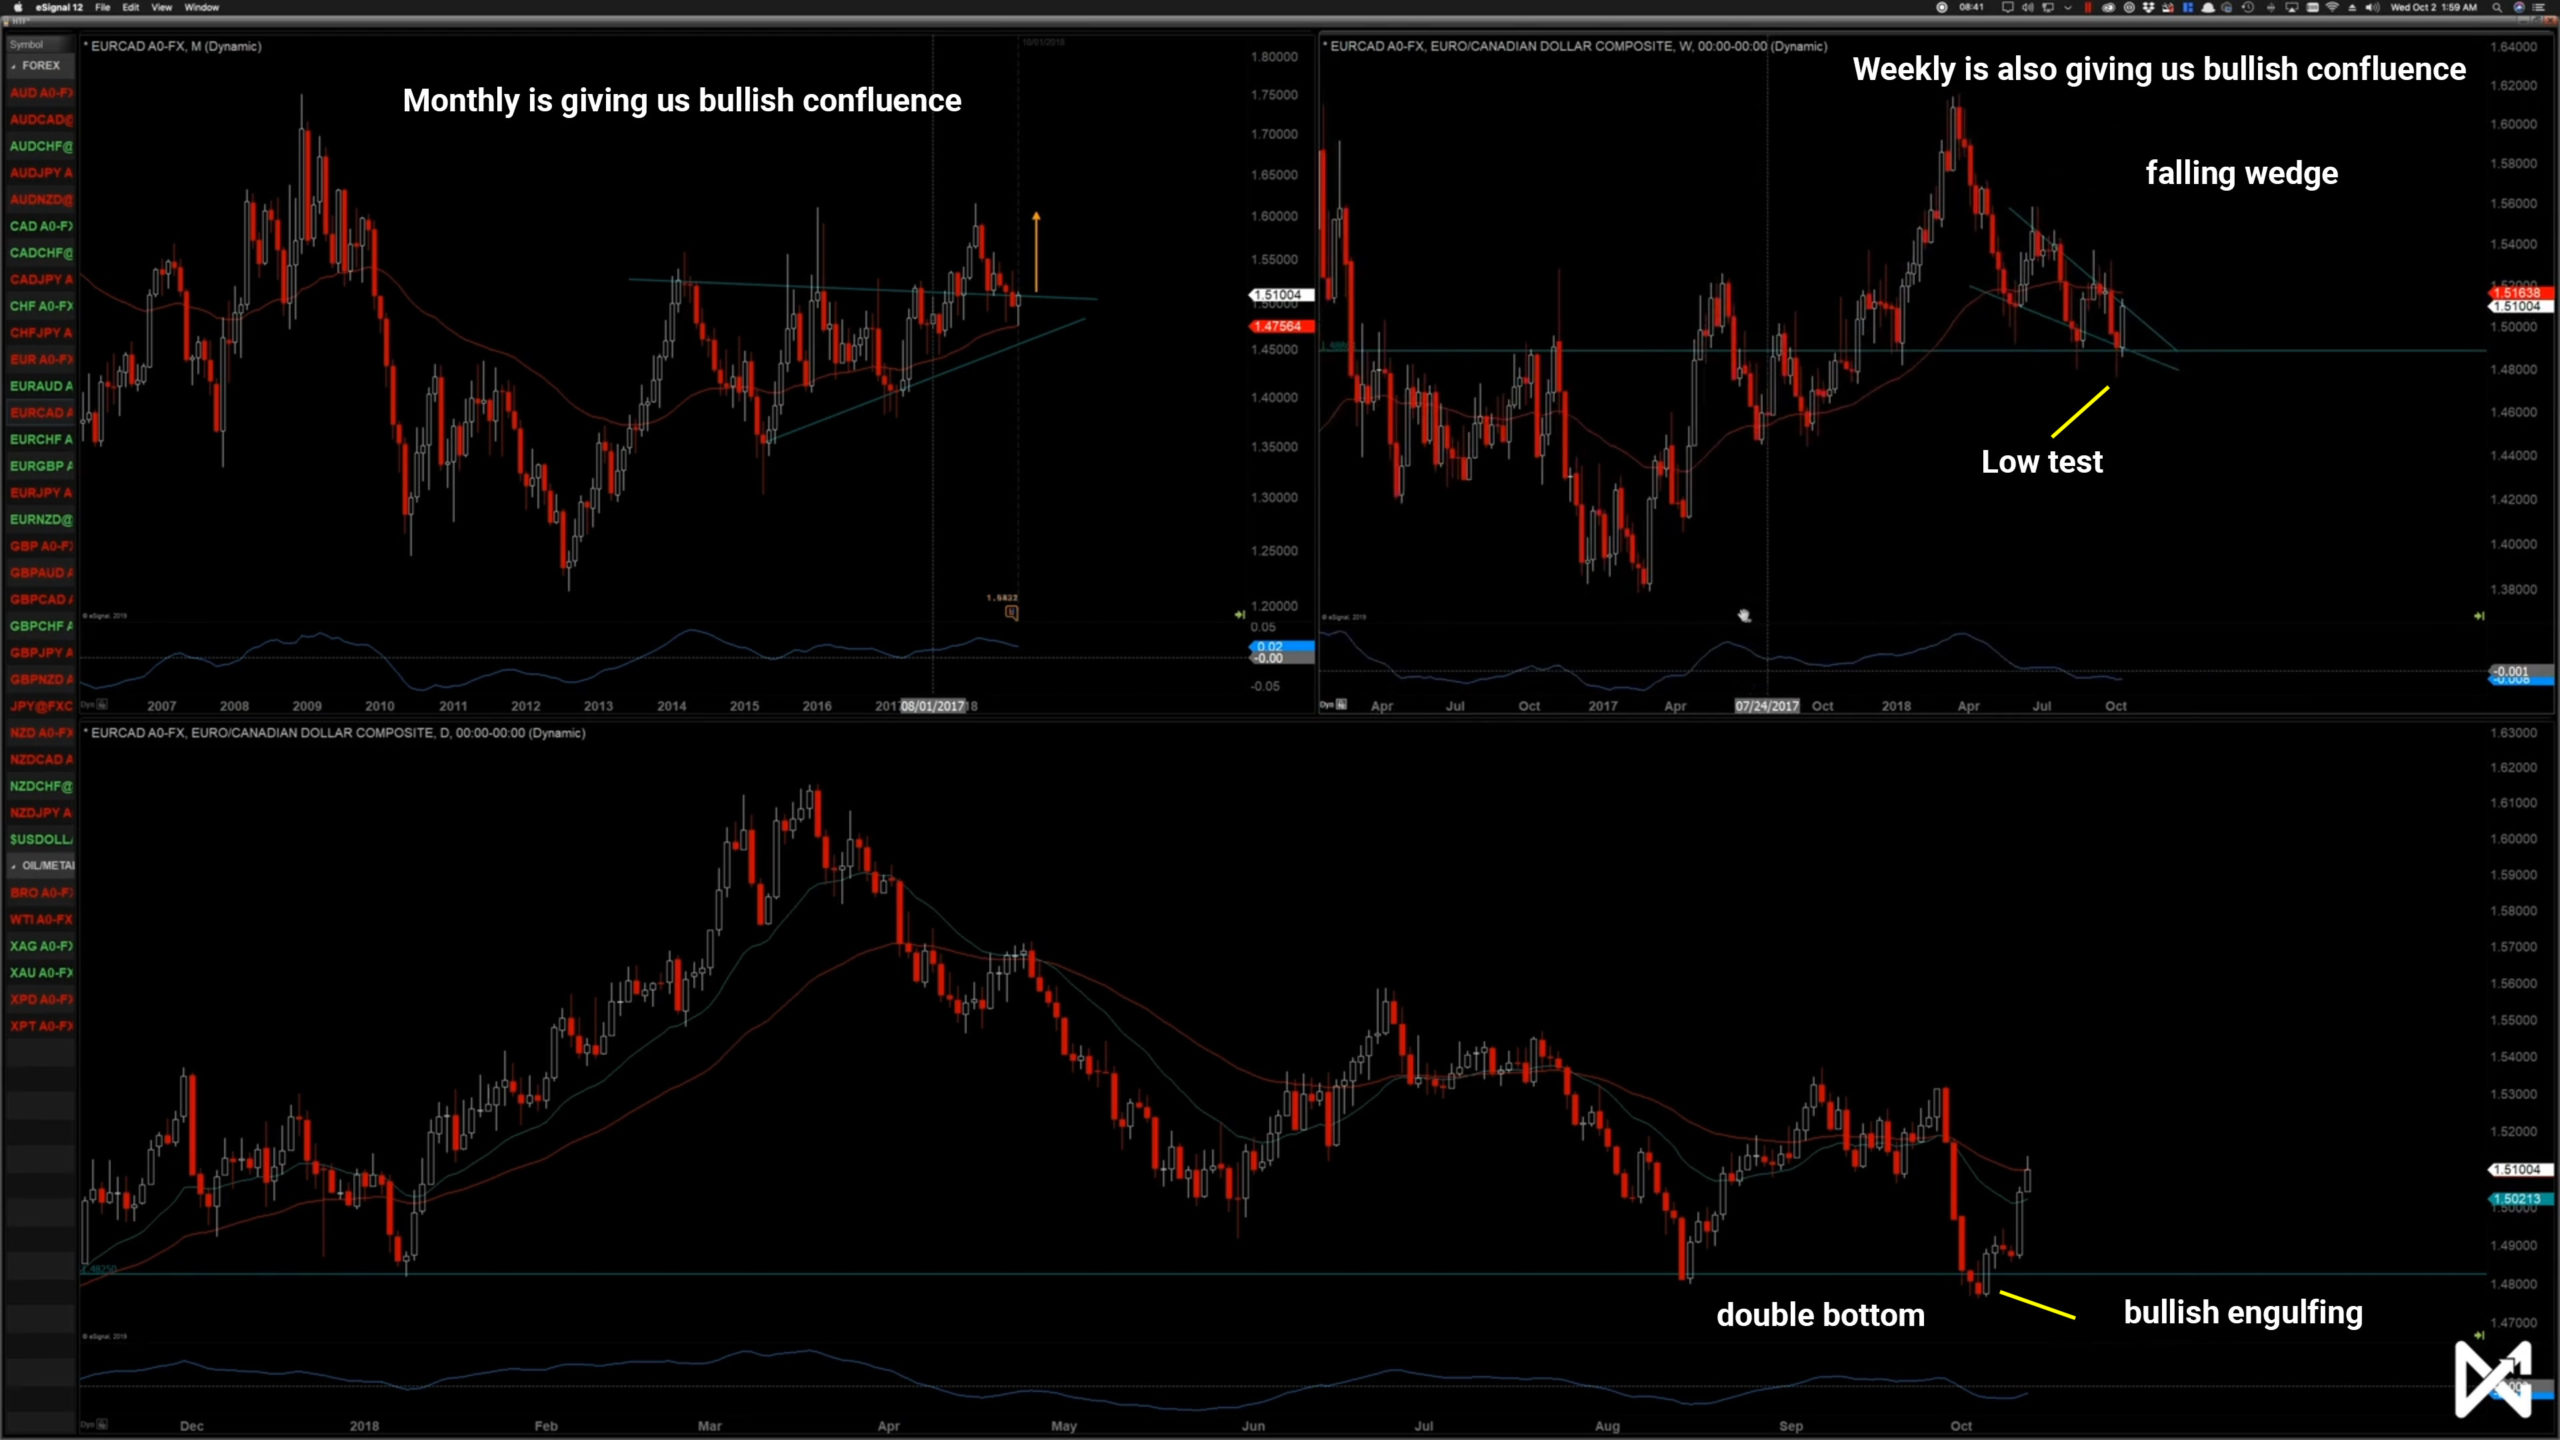
1: We need some kind of small break and retest of some kind of support/resistance on higher timeframe specifically on the daily chart. We don't need a candlestick formation. We also check the weekly and monthly charts for bias/confluence. We want to make sure it's not massively against us.
2: A big run on the 4h and a deep pullback to the 4h 50 EMA and rejection of that 50 EMA.
3: We need some kind of a wedge, a pattern on the 1h.
4: We need momentum, some kind of candlestick formation on the 1h and preferably on the 4h chart as well.
5: Making sure we can get at least a 2:1 R:R.
The most ideal target is the previous 4h highs/lows, but you can target 0.618 fibonacci extension too.
Knowing and understanding ACB will help you with understanding IBO-C's. It will help you spot traps.
Advanced Continuation Breakout - Execution
In this lesson, you’ll learn how to execute the Advanced Continuation Breakout (ACB) strategy, from entry, to stop, to target placement.
With an ACB we are mainly going to be using a live market entry.
14.Strategy #5 - PLB
Phase Line Break - Coming soon
15.Trade Management
Short-term
Short-term management is a fully mechanical approach, utilizing the 1H timeframe. It can be utilized by both day traders and swing traders (as with this technique, you will hold trades anywhere from roughly a day to a week).
Enter on a trend change, exit on a trend change.
Short term management is simply following the trend and putting our stop-loss nicely above the 1hour 50 EMA.
As soon as you can see that there is a trend change (breaking trend line for example, you can exit the trade, no need to wait for it to hit your stop-loss.
If you are at the charts exit as soon as the breakout is happening, but as traders we also have lives, so it's fine if we just keep trailing our S/L along the 1h 50EMA and let it hit.
Long-term
Long-term management is a fully mechanical approach, utilizing the 4H timeframe. This technique applies more when there are longer-term opportunities in the market as it’s used for holding positions that typically last longer than a week. This technique is more related to swing trading, however, you can utilize it as a day trader, which Irek will break down in this lesson.
The concept is the same as the short-term management, but here instead of trailing the 1 hour 50 EMA, we will be trailing the 4 hour 50 EMA.
Short-term Aggressive
Short-term aggressive management is a fully discretionary approach and is utilized when there is high volatility in the market. This is a technique where you may choose to manually close a position and take profit, instead of holding through a potential pullback.
Short-term Aggressive is usually used above 3% profit.
16.Holy Grail
The Hybrid
Learn more about the hybrid style (the ‘Holy Grail’ of Irek’s trading), and how you can utilize characteristics of both day trading and swing trading to capitalize on market movements.
The holy grail happens roughly every month to 2 months. It is a setup that will bring at least a 5:1 R:R
We have a bullish bias all the way from the monthly down to the 5 minute timeframe.
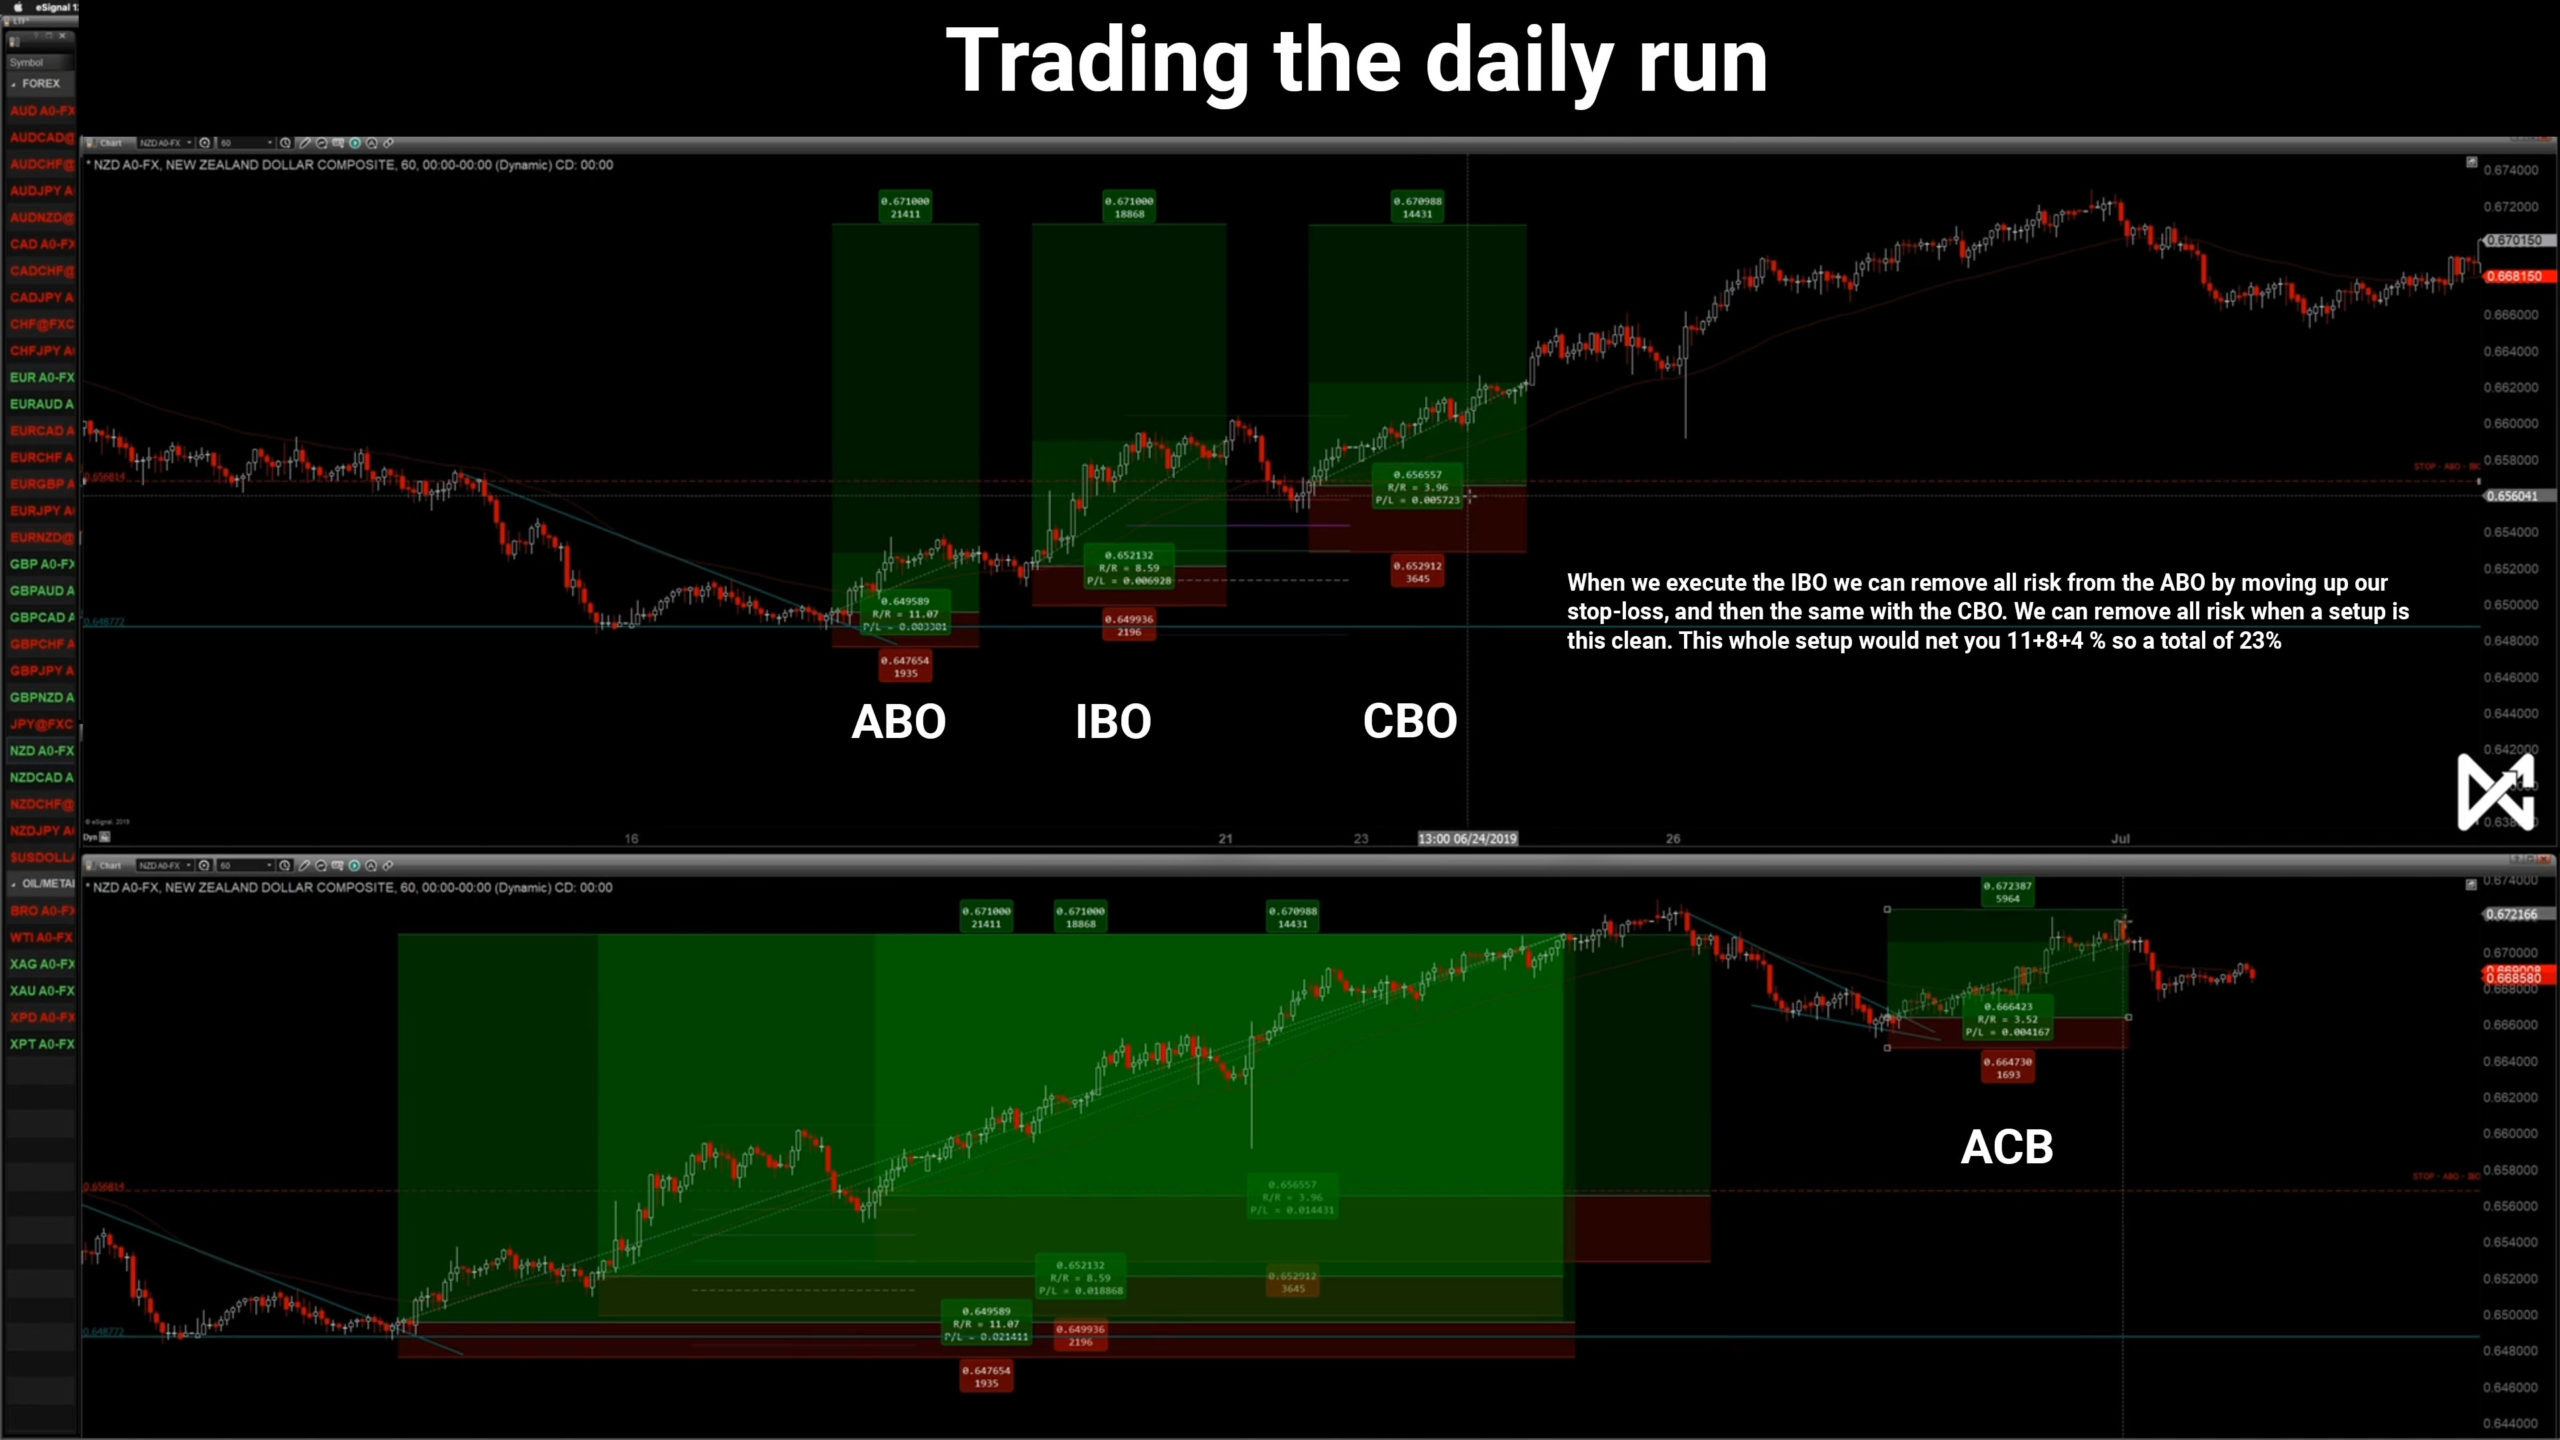
The “Scale In”
In this lesson you’ll learn how to ‘scale in’, utilizing multiple strategies to catch the same daily run. You can consider this another ‘Holy Grail’ approach and can utilize the ‘scale in’ to generate more profit, without adding any additional risk (when done correctly).
17.Swing Trading
Introduction to Swing Trading
In this lesson, Irek talks about the benefits of swing trading and shows how you can apply the strategies to the higher timeframes.
Ezt újranézni és képekkel kiegészíteni majd.
Swing Trading vs Day Trading
In this lesson, you'll learn the difference between swing trading and day trading and the characteristics of both.
Swing trading is for those who cant commit to day trading. Who have a 9-5, a student, traveler, etc.
As a swing trader you make your watchlist on a Sunday, place your alerts, orders, and you are done.
You mainly focus on the monthly, weekly daily and maybe execute on the 1 hour chart.
With swing trading you mainly focus on the wave 1 breakout, wave 3 run and wave 5 run.
As a day trader you will make a watchlist daily. You focus on the lower timeframes during the week, and also make a higher timeframe watchlist on a Sunday.
You mainly focus on the daily, 4 hour, 1 hour and execute a trade on the 5 minute chart.
18.Strategy #6 - SBO
Swing Breakout - Explanation
Learn exactly what the Swing Breakout (SBO) is. This is a strategy focused on the higher timeframes and as long as the setup criteria are present on the HTFs, this strategy will always give you an entry.
Criterias:
1: We have one of the strategies on the HTFs, ABO, IBO, CBO, ACB.
2: We are always trading with the trend. Wave 1,3,5 breakout. Sometimes with enough confluence we can also trade wave 2,4 pullbacks.
3: We have deceleration at support level and the 1 hour chart is developing a trend change.
4: Breakout on the 1 hour. We wait until the trend is confirmed.
5: Stop-loss below the lows.
Swing Breakout - Execution
In this lesson, you’ll learn how to execute the Swing Breakout strategy, from entry, to stop, to target placement.
19.Market Phases
Trading Different Market Phases
This lesson builds on the concepts we’ve already learned, such as the Elliott Wave Theory. This lesson is really important for deciding where to place your targets when trading runs and pullbacks. Many people get this wrong, so re-watch this lesson multiple times to ensure you grasp the concepts.
You don't want to stretch your targets on pullbacks (wave 2, wave 4)
ABO on a lower timeframe = 4h 50 EMA
IBO on a lower timeframe = 4h 50 EMA
CBO on a lower timeframe = Recent Highs/Lows
If you are a swing trader you might want to stay away from pullbacks.
Market Cycles
In this lesson, we’ll come back to the fractal approach, and look at market cycles that occur on multiple timeframes. Many traders get out of sync with the market cycles (and therefore, miss the optimal trading opportunities). In this lesson, Irek discusses how to get back in sync with the market and the importance of understanding how the cycles move.
20.Identifying Traps
Identifying Traps
There are various traps that occur in the market, which may seem like relatively decent opportunities, but in reality, they are not. This lesson is about capital preservation. It’s extremely important to know how to identify traps within the market and stay out of them.
A trap is typcically only half of the strategy showing itself.
A lot of the times the middle timeframe does not fit the strategy.
For example the higher timeframes are all bearish and even the 1 hour chart has a nice setup, but when you look at the 4 hour chart, it is bullish.
When there is doubt, stay out.
21.Watchlist Creation
Swing Watchlist Creation
In this lesson, you’ll learn how to make your swing trading watchlist (higher timeframe watchlist).
Daily Watchlist Creation
In this lesson, you’ll learn how to make your day trading watchlist (lower timeframe watchlist).
22.Journaling & Backtesting
Journaling & Backtesting
Journaling is one of the most important things that a trader can do. Data collection is key because, without it, you won’t know where to improve and where the mistakes are being made.
23.Tips & Tricks
News
Learn about news and how to navigate the markets when high-impact announcements and fundamentals come into play. Here is a Guide to Major Economic News Announcements and Global Events. We recommend you review this document to understand what types of announcements and events can affect the markets: https://irekpiekarski.com/guide-to-major-economic-news-announcements-global-events/
Gaps
Learn what gaps are in the market, why they’re caused and how to deal with them.
Discretion
Many traders use discretion the wrong way. Trading is all about following certain rules, principles, and strategies. The majority of what we teach in Trading MasterClass is very mechanical and straight to the point (with minimal discretion), however, discretion can be applied in certain cases and this lesson will break it down.
Trading Routines
As a day trader, the common thinking is that you have to be on the computer 24 hours a day. But that is simply not true. In this lesson, Irek addresses what a typical day trading and swing trading routine should look like.
24.Conclusion
Congratulations
Congratulations on finishing Trading MasterClass!
If this is your first time going through the program, then you may wish to review the lessons multiple times over until the concepts are clearly understood and digested. There is a lot of information here, so please be patient with yourself as you learn to navigate the trading space. Never forget that your journey is your own.
Next steps for success: continue to evolve and develop as a trader. The opportunities are endless!
GGWP
Position Size Calculator
FX Pip Value Calculator
Motivation
Jaguar F-Type R €55,000
Suzuki GSX S-750 €6,500
Óra 2020 Végén
HUBLOT CLASSIC FUSION
ORLINSKI TITANIUM €8,500
VAGY
ROLEX SUBMARINER REF 114060 €8,300
Bearbrick Bait Gold Bar 400 €300
20cm Richard Orlinski King Kong €30
KAWS Companion Open Edition Black €300
1199 Summit Dr
€3,400,000
Laguna Beach, CA
Ez a honlap sütiket használ. A sütik elfogadásával kényelmesebbé teheti a böngészést. A honlap további használatával hozzájárulását adja a sütik használatához. Adatvédelmi TájékoztatóElfogadom
Necessary cookies are absolutely essential for the website to function properly. This category only includes cookies that ensures basic functionalities and security features of the website. These cookies do not store any personal information.
Any cookies that may not be particularly necessary for the website to function and is used specifically to collect user personal data via analytics, ads, other embedded contents are termed as non-necessary cookies. It is mandatory to procure user consent prior to running these cookies on your website.